Author Archives: alphabetaworks

Top Stock Pickers’ Exposure to Valeant

In Early – Out Just in Time

Our recent article established that a portfolio of skilled stock pickers’ ideas generates consistent alpha.  This brief analyzes what the AlphaBetaWorks Expert Aggregate had to say about one controversial name, Valeant Pharmaceuticals (VRX).  In short, the smart money was in early and left almost a year before Valeant’s recent headaches.

Performance of the Top U.S. Stock Pickers

Since genuine investment skill persists, top U.S. stock pickers tend to generate persistently positive returns from security selection (idiosyncratic, residual returns). This strong performance derives from the top stock pickers’ individual positions. Their consensus exposures thus cut through the fog of panic and confusion, such as that surrounding VRX.

We track institutional ownership of Valeant by the AlphaBetaWorks Expert Aggregate (ABW Expert Aggregate). The ABW Expert Aggregate is sourced from all institutions that have filed Form 13F.

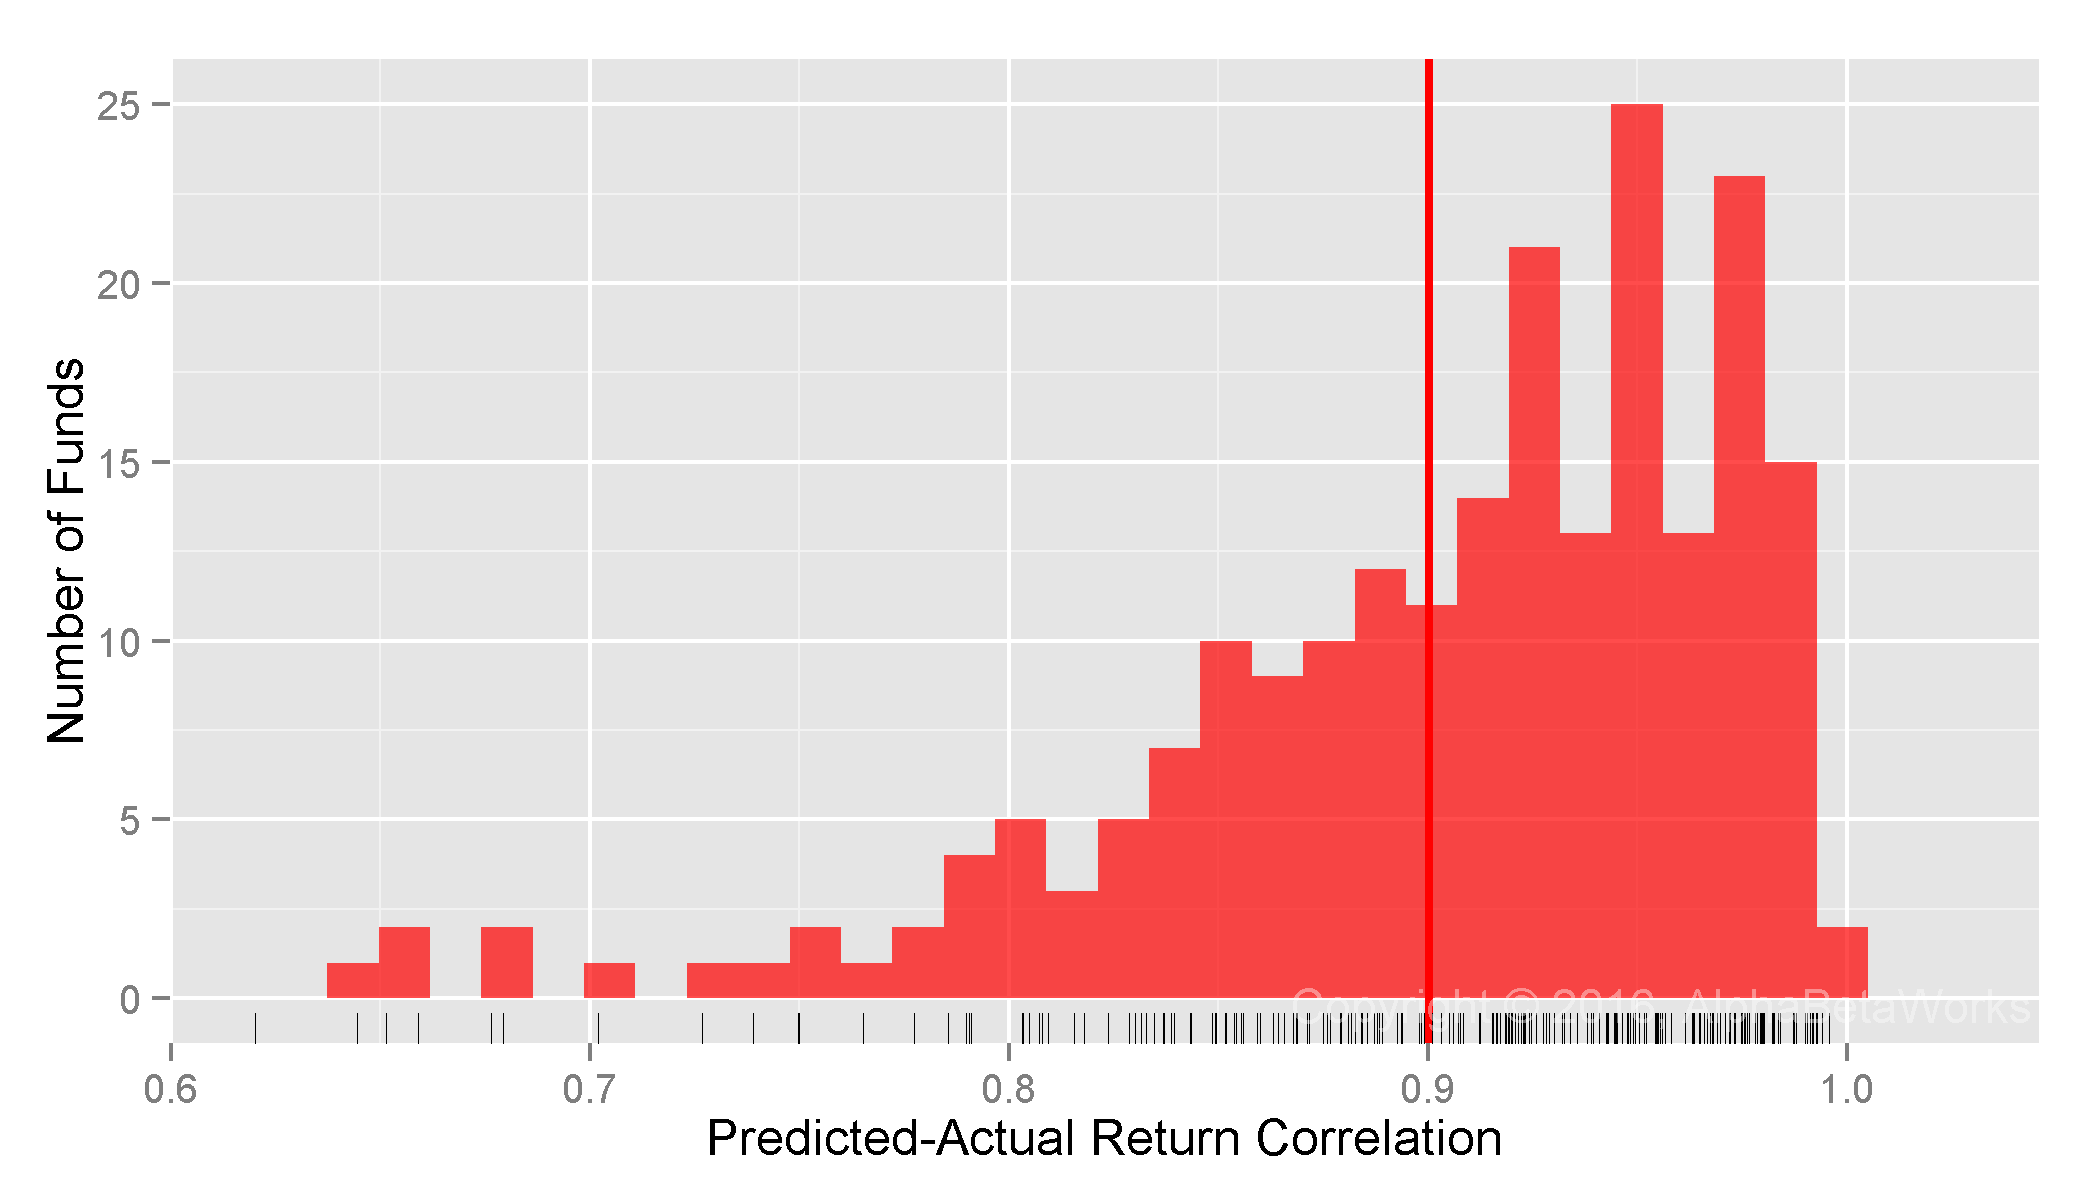
Nominal returns and related simplistic metrics of investment skill (Sharpe Ratio, Win/Loss Ratio, etc.) are dominated by systematic factors and thus revert. So for an accurate assessment of manager skill, we must eliminate the systematic effects and estimate residual performance due to stock picking. The AlphaBetaWorks Performance Analytics Platform calculates each portfolio’s return from security selection – αReturn. αReturn is the performance a portfolio would have generated if all factor returns had been flat. Each month we identify the five percent of 13F-filers with the most consistently positive αReturns over the prior 36 months. This expert panel of the top stock pickers typically consists of 100-150 firms.

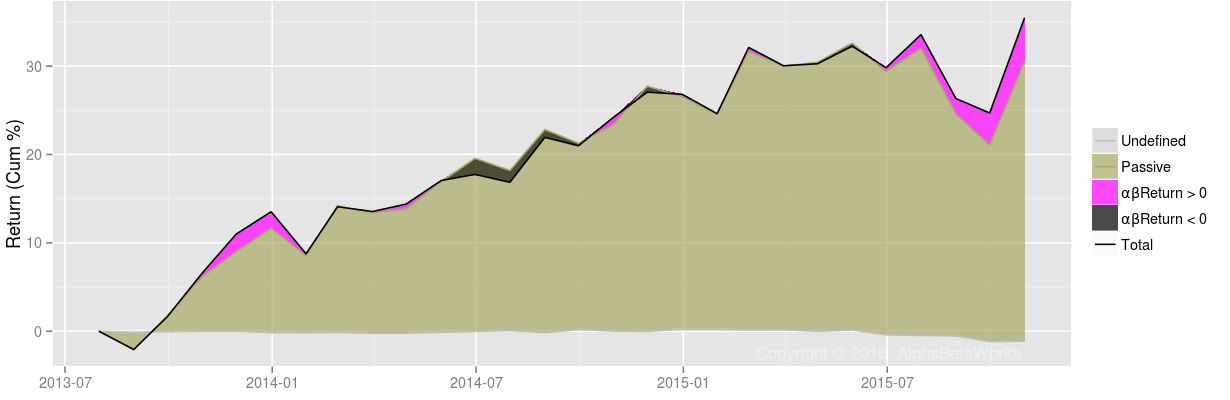
A hedged portfolio that combines the top U.S. stock pickers’ net consensus longs (relative overweights) – lagged 2 months to account for filing delay (the ABW Expert Aggregate) – delivers consistent positive returns as illustrated below:

Chart of the cumulative return of the Market (Russell 3000) and the cumulative return of the hedged portfolio that combines the to 5% U.S. long stock pickers net consensus long (relative overweight) exposures

Cumulative Hedged Portfolio Return: Top U.S. Stock Pickers’ Net Consensus Longs

2005 2006 2007 2008 2009 2010 2011 2012 2013 2014 2015 2016
ABW Expert Aggregate 4.56 14.43 12.74 5.95 -1.25 15.35 2.20 2.24 15.47 8.81 13.16 1.70
iShares Russell 3000 ETF 9.04 15.65 4.57 -37.16 28.21 16.81 0.78 16.43 32.97 12.41 0.34 -5.72
ABW Expert Aggregate iShares Russell 3000 ETF
Annualized Return 8.36 6.40
Annualized Standard Deviation 5.25 15.50
Annualized Sharpe Ratio (Rf=0%) 1.59 0.41

Top Stock Pickers’ Exposure to Valeant Pharmaceuticals (VRX)

The positive idiosyncratic returns of the ABW Expert Aggregate come from its individual positions: Its longs (experts’ relative overweights) tend to generate positive future αReturns. Its shorts (experts’ relative underweights) tend to generate negative future αReturns. The ABW Expert Aggregate thus measures the top stock pickers’ positioning which is predictive of the stocks’ future performance.

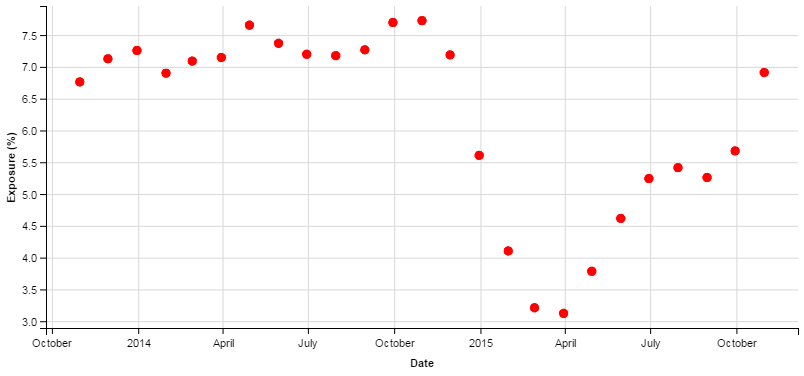
The top panel on the following chart shows the performance of VRX. Nominal returns are in black and cumulative residual returns (αReturns) are in blue. αReturn is the performance VRX would have generated if all systematic factor returns had been flat. The bottom panel shows exposure to VRX within the ABW Expert Aggregate:

Chart of the cumulative αReturn (residual return) of Valeant Pharmaceuticals (VRX) and exposure to VRX within the hedged portfolio that combines the to 5% U.S. long stock pickers net consensus long (relative overweight) exposures

VRX: Cumulative αReturns and Exposure within the ABW Expert Aggregate

Top stock pickers had negligible exposure to VRX until 2011. In early-2011 smart-money exposure to VRX grew rapidly, peaking between 2012 and 2014. Throughout 2014, as the shares appreciated, the top U.S. stock pickers sharply cut their exposure to VRX.

The panic hit a year after the top stock pickers dramatically cut their exposure. By 2015 smart-money exposure to VRX was a mixed signal as it tracked the stock’s volatility. Ironically, this is when VRX became one of the most crowded hedge fund bets. Though VRX had a history of smart-money ownership, this vote of confidence was withdrawn by 2015. Future stock-specific returns to VRX, as predicted by the ABW Expert Aggregate, increased rapidly in 2011 and dropped rapidly by 2015.

Investors, allocators, and fund-followers, armed with our analytics, would have taken note. Those looking for the smart money to back their long or short views of VRX must now look elsewhere.

Conclusions

  • Top stock pickers’ ownership is predictive of future stock performance, since their net consensus longs (relative overweights) tend to generate positive future αReturns and net consensus shorts (relative underweights) tend to generate negative future αReturns.
  • Valeant Pharmaceuticals (VRX) was a large overweight of the top stock pickers between 2011 and 2014, but these positions were mostly liquidated by 2015.
  • Top stock pickers’ current ownership of VRX is not a predictive indicator, but their rapid liquidation in 2014 was a visible warning.
The information herein is not represented or warranted to be accurate, correct, complete or timely.
Past performance is no guarantee of future results.
Copyright © 2012-2016, AlphaBetaWorks, a division of Alpha Beta Analytics, LLC. All rights reserved.
Content may not be republished without express written consent.
U.S. Patents Pending.

Testing Equity Risk Models: REIT Portfolios

Equity risk models can be complex and hard to interpret. Moreover, differences in financial reporting and transparency across markets, sectors, and companies can lead to inaccurate predictions and counter-intuitive exposures for common fundamental models. These problems are especially severe for sector-focused portfolios. For instance, generic fundamental models may use a single broad Leverage Factor to explain the profoundly different impacts of financial leverage on the risk of Airlines, REITs, and Oil Producers, with mixed results at best. Yet, when properly constructed with robust methods, statistical equity risk models that capture the relevant and intuitive sector-specific risk factors are highly predictive. We illustrate this predictive accuracy with a study of 1,000 REIT portfolios.

Real Estate Investment Trust (REIT) Portfolio Sample

We used Vanguard REIT Index Fund (VNQ) to define the Real Estate Investment Trust (REIT) Market Universe. To test equity risk models on realistic REIT portfolios, we constructed 1,000 random portfolios from VNQ. Each portfolio contained 20 equal-weighted positions and spanned 10 years. These random subsets of the REIT Universe should be representative of a typical REIT portfolio based on VNQ’s holdings with a 5% average position size.

Testing Predictive Power of Equity Risk Models

We follow the approach of our earlier studies of risk model accuracy. To evaluate the predictive accuracy of an equity risk model, we compare returns predicted by past factor exposures to the subsequent portfolio performance: We calculate factor exposures using holdings at the end of each month and predict the following month’s returns using these ex-ante factor exposures and ex-post factor returns.

The correlation between predicted and actual returns measures a model’s accuracy. The higher the correlation, the more effective a model is at hedging, stress testing and scenario analysis, as well as evaluating investment skill.

Testing Statistical Equity Risk Model with High-level Sectors

The default AlphaBetaWorks U.S. Equity Statistical Risk Model uses 10 high-level Sector Factors in addition to Market, Style (Value/Growth and Size) and a few Macroeconomic Factors (Bonds, Oil, Currency, etc.). Though these high-level factors are sufficient to predict accurately the performance of most mutual fund portfolios and most long equity hedge fund portfolios, they do not adequately capture the sector-specific systematic risk of REITs with their broad Finance Factor. In short, our model’s “standard setting” does not provide a fine enough focus for these instruments. For half of the REIT portfolios tested, the model delivers less than 0.80 correlation between predicted and actual monthly returns:

Chart of the correlations between predicted returns constructed using a multi-factor statistical equity risk model and actual historical returns for 1,000 20-position REIT portfolios constructed from the holdings of Vanguard REIT Index Fund (VNQ)

U.S. REIT Portfolios: Correlation between predictions and actual monthly returns for a statistical equity risk model with high-level sectors

  Min. 1st Qu.  Median    Mean 3rd Qu.    Max.
0.7052  0.7821  0.8038  0.8021  0.8250  0.8823

Testing Statistical Equity Risk Model with Granular Sectors

For REITs, a more focused model is necessary. Fortunately, we offer such refined models for more accurate results. The 10 high-level sectors of the default AlphaBetaWorks U.S. Equity Statistical Risk Model can be sub-divided into more granular sectors to handle portfolios that are restricted to a narrow market subset. The AlphaBetaWorks Granular Sector Model that includes the REIT Sector Factor is far more effective in this case. For most REIT portfolios tested, the model delivered 0.94 or higher correlation between predicted and actual monthly returns:

Chart of the correlations between predicted returns constructed using a multi-factor statistical equity risk model with granular sectors and actual historical returns for 1,000 20-position REIT portfolios constructed from the holdings of Vanguard REIT Index Fund (VNQ)

U.S. REIT Portfolios: Correlation between predictions and actual monthly returns for a statistical equity risk model with granular sectors

  Min. 1st Qu.  Median    Mean 3rd Qu.    Max.
0.7886  0.9202  0.9385  0.9324  0.9507  0.9766

Even for the 25% REIT portfolios it handled the worst, the model still achieved 0.79-0.92 correlation between predicted and actual returns.

Summary

  • Fundamental equity models often fail for sector-focused portfolios, such as REITs.
  • Statistical equity risk models with a few intuitive factors deliver accurate predictions for sector-focused portfolios, provided they are sufficiently robust and granular.
  • For most REIT portfolios tested, a robust statistical equity risk model with a REIT Sector Factor delivered over 0.94 correlation between predicted and actual monthly returns.
  • Greater model complexity offers diminishing returns: Even a perfect equity risk model would, at most, yield 0.06 higher correlation and explain 12% more ex-post monthly return variance.
The information herein is not represented or warranted to be accurate, correct, complete or timely.
Past performance is no guarantee of future results.
Copyright © 2012-2016, AlphaBetaWorks, a division of Alpha Beta Analytics, LLC. All rights reserved.
Content may not be republished without express written consent.

Systematic Hedge Fund Volatility

Hedge fund replication, tracking, and analysis often focus on the individual positions and on the stock-specific risk they contribute. This overlooks the far more important return source – systematic hedge fund volatility. A statistical equity risk model that robustly captures exposures to the key systematic risk factors delivers 0.92 (92%) correlation between predicted and actual returns for most hedge fund long equity portfolios reported in regulatory filings. It follows that risk, performance, and crowding of these portfolios are overwhelmingly systematic. These systematic returns can be replicated and hedged with models built on investable factors and with passive investments that track these factors. Fixation on individual holdings and position overlap is misguided at best and dangerous at worst.

U.S. Hedge Fund Equity Portfolio Sample

Our analysis covers approximately 300 U.S. hedge fund long equity portfolios active over the past 15 years. We started with the universe of over 1,000 funds. First, we eliminated half that were not analyzable from regulatory filings (primarily because of high turnover). We then eliminated the portfolios that had less than five years of contiguous history or fewer than five equity positions during a period.

Our conclusions apply to most hedge fund long equity portfolios, though high turnover funds will require higher frequency of position data for predictive return forecasts. By extension, these findings also apply to long-biased hedge funds that derive most of their performance from their long portfolios. They apply to short books as well: our experience shows that short hedge fund books tend to be even more diversified and hence even more governed by their systematic exposures (possibly due to managers’ sensitivity to stock-specific risk). Finally, systematic volatility is even higher for funds of hedge funds due to their higher diversification.

Testing the Predictive Power of Equity Risk Models for Hedge Funds

To quantify the share of systematic hedge fund volatility, we need to test the ability of an equity risk model to predict future hedge fund returns. We followed the approach of our earlier studies of equity risk models’ predictive power:

  • Calculated factor exposures from the estimated holdings at the end of each month and the holdings’ factor exposures;
  • Predicted the following month’s returns using these ex-ante factor exposures and ex-post factor returns;
  • Compared returns predicted by past factor exposures to subsequent portfolio performance and evaluated the predictive accuracy of a model.

The correlation between predicted and actual returns measures a model’s accuracy and determines the fraction of systematic hedge fund volatility as defined by the model. The higher the correlation, the more effective a model is at hedging, stress testing, replication, and evaluating investment skill.

Systematic Hedge Fund Volatility within a Single-Factor Statistical Equity Risk Model

The simplest statistical equity risk model uses a single systematic risk factor – Market Beta. Since Market Beta is the dominant risk factor, even a simple model built with robust statistical methods delivers 0.87 mean and 0.90 median correlations between predicted and actual monthly returns:

Chart of the correlations between predicted returns constructed using a single-factor statistical equity risk model and actual historical returns for the equity portfolios of over 300 U.S. Hedge Fund Long Equity Portfolios

U.S. Hedge Fund Long Equity Portfolios: Correlation between a single-factor statistical equity risk model’s predictions and actual monthly returns

  Min. 1st Qu.  Median    Mean 3rd Qu.    Max. 
0.2924  0.8251  0.8978  0.8665  0.9420  0.9938

Within this model, 81% of hedge fund variance is systematic.

Systematic Hedge Fund Volatility within a Two-Factor Statistical Equity Risk Model

A two-factor model that adds Sector Risk Factors, estimated with robust methods, delivers 0.89 mean and 0.92 median correlations between predicted and actual monthly returns:

Chart of the correlations between predicted returns constructed using a two-factor statistical equity risk model and actual historical returns for the equity portfolios of over 300 U.S. Hedge Fund Long Equity Portfolios

U.S. Hedge Fund Long Equity Portfolios: Correlation between a two-factor statistical equity risk model’s predictions and actual monthly returns

  Min. 1st Qu.  Median    Mean 3rd Qu.    Max. 
0.5843  0.8584  0.9159  0.8946  0.9502  0.9957

Systematic Hedge Fund Volatility within a Multi-Factor Statistical Equity Risk Model

The standard AlphaBetaWorks U.S. Equity Statistical Risk Model extends the two-factor model with Style Factors (Value/Growth and Size) and Macroeconomic Factors (Bonds, Oil, Currency, etc.). This expanded model delivers 0.90 mean and 0.92 median correlations between predicted and actual monthly returns for U.S. hedge fund long equity portfolios:

Chart of the correlations between predicted returns constructed using a multi-factor statistical equity risk model and actual historical returns for the equity portfolios of over 300 U.S. Hedge Fund Long Equity Portfolios

U.S. Hedge Fund Long Equity Portfolios: Correlation between a multi-factor statistical equity risk model’s predictions and actual monthly returns

  Min. 1st Qu.  Median    Mean 3rd Qu.    Max. 
0.5055  0.8646  0.9204  0.9003  0.9554  0.9957

For the 25% of hedge fund portfolios it handles the worst, the model still achieves 0.51-0.86 correlation between predicted monthly returns and realized monthly returns.

Many of the outliers with low correlations hold substantial fixed income, exotic, and hybrid positions. To provide the most conservative assessment of the model’s predictive accuracy and the proportion of systematic risk, we did not alter the universe to exclude these outliers.

Unsurprisingly, given hedge funds’ aggressiveness, the model is less predictive for hedge funds than they are for mutual funds and insurance companies. Still, 85% of monthly return variance of most hedge fund long equity portfolios is systematic. And over 80% of that is due to a single factor. In other words, investors could replicate over 80% of this variance simply by replicating the hedge funds’ Market exposure.

Amazingly, much of the popular analysis of hedge fund risk and crowding ignores systemic factors and focuses solely on individual positions. This simplistic approach, even in the rare cases where it is done correctly, addresses only 15% of the risk that is residual, idiosyncratic, or stock-specific. Investors who rely on these simplistic approaches will make a variety of mistakes. For instance, they might wrongly conclude that two funds are differentiated because they have no positions in common. Yet, these two funds can have similar systematic factor exposures and thus high correlation; market hiccups will be magnified.

Conclusions

  • For most U.S. hedge fund long equity portfolios estimated from regulatory filings, a robust statistical equity risk model delivers over 0.92 correlation between predicted monthly returns and realized monthly returns.
  • 85% of the monthly return variance of hedge fund long equity portfolios is systematic, hence not attributable to individual stock bets.
  • Fixation on hedge funds’ stock-specific bets and crowding is misguided and dangerous, since this risk accounts for at most 15% of the portfolio variance for most hedge funds.
  • Investors who rely on simplistic approaches to hedge fund risk analysis may make a variety of mistakes, including missed crowding due to shared systematic factor exposures.
The information herein is not represented or warranted to be accurate, correct, complete or timely.
Past performance is no guarantee of future results.
Copyright © 2012-2016, AlphaBetaWorks, a division of Alpha Beta Analytics, LLC. All rights reserved.
Content may not be republished without express written consent.

Do Equity Risk Models Need a Quality Factor?

It is common to augment risk models with numerous interrelated factors. This causes problems: Size, Value, Quality, Volatility, and their kin have much in common. At best, overzealous addition of related factors leads to unnecessarily bloated models. At worst, it leads to overfitting, multicollinearity, and questionable statistical analysis.

Fortunately, most complex factors derive virtually all of their volatility and performance from more basic ones such as Market, Sectors, and Size. Therefore, simple statistical equity risk models that capture a few intuitive investable factors with robust statistics usually suffice to describe and predict the performance of investable portfolios of more complex factors. We illustrate this with a popular Quality Factor ETF.

Attributing the Performance of a Quality ETF to Simpler Factors

We analyzed a popular Quality ETF using the AlphaBetaWorks Statistical Equity Risk Model – a proven tool for forecasting portfolio risk and performance. We estimated monthly positions from regulatory filings and aggregated positions’ factor (systematic) exposures. This produced a series of monthly portfolio exposures to simple investable risk factors such as Market, Sector, and Size. The factor exposures and subsequent factor returns were used to calculate future residual (security-selection, idiosyncratic, stock-specific) returns un-attributable to these simple investable factors.

iShares MSCI USA Quality Factor (QUAL): Performance Attribution

We used iShares MSCI USA Quality Factor (QUAL) as an example of a practical implementation of a quality factor portfolio. QUAL is a $1.7bil ETF that seeks to track an index of U.S. large- and mid-cap stocks with high return on equity, high earnings variability, and low debt-to-equity ratio.

iShares MSCI USA Quality Factor (QUAL): Factor Exposures

The following non-Quality factors are responsible for most of the historical returns and variance of QUAL within the parsimonious statistical equity risk model used:

Chart of exposures to the risk factors contributing most to the historical performance of iShares MSCI USA Quality Factor (QUAL)ETF

iShares MSCI USA Quality Factor (QUAL): Significant Historical Factor Exposures

Latest Mean Min. Max.
Market 88.99 85.98 81.07 89.44
Technology 19.93 33.39 19.93 37.35
Health 15.56 17.44 12.34 20.54
Consumer 35.08 33.41 28.70 35.50
Industrial 13.60 11.40 8.86 13.92
Energy 4.14 5.76 3.05 12.02
Size 9.11 6.27 2.91 9.11
Value -0.93 -0.78 -1.54 0.10
Oil Price -1.83 -0.09 -1.83 1.17
Finance 4.95 -1.22 -2.57 4.95

For instance, since Quality companies tend to be larger, some of QUAL’s performance is due to its long exposure to the Size Factor (overweighting of stocks that behave like large-capitalization companies):

Chart of the historical exposures to the Size Factor of iShares MSCI USA Quality Factor (QUAL)ETF

iShares MSCI USA Quality Factor (QUAL): Historical Size Factor Exposures

iShares MSCI USA Quality Factor (QUAL): Active Return

To replicate QUAL with simple non-momentum factors, one can use a passive portfolio of these simple non-momentum factors with QUAL’s mean exposures to them as weights. This portfolio defined the Passive Return in the following chart. Active return, or αβReturn, is the performance in excess of this passive replicating portfolio. It in turn is the sum of active return from residual stock-specific performance (αReturn) and active return from variation in factor exposures, or factor timing (βReturn):

Chart of the cumulative historical active return from security selection and factor timing of iShares MSCI USA Quality Factor (QUAL)ETF

iShares MSCI USA Quality Factor (QUAL): Cumulative Passive and Active Returns

QUAL’s performance closely tracks the passive replicating portfolio. Pearson’s correlation between Total Return and Passive Return is 0.97 – 94% of the variance of monthly returns is attributable to passive factor exposures, primarily to Market, Sector, and Size factors. Active return – performance due to idiosyncratic Quality effects rather than simpler factors – is negligible. Even without a factor to identify quality, the model comprehensively captures the risk and performance of QUAL.

QUAL offers convenient and cheap exposure to quality companies. We cite it here as an example of the reduction of the Quality Factor to simpler non-Quality factors. More elaborate, non-transparent, and expensive smart beta strategies can be hazardous. Many “smart beta” funds are merely high-beta and offer no value over portfolios of conventional dumb-beta funds. It is thus vital to test any new resident of the Factor Zoo to determine whether they are merely exotic breeds of its more boring residents.

Conclusion

  • Investable portfolios based on complex factors such as Quality, tend to derive virtually all of their volatility and performance from more basic factors, such as Market, Sectors, and Size.
  • A popular Quality ETF, iShares MSCI USA Quality Factor (QUAL), has had 0.97 correlation with a passive replicating portfolio of basic non-quality factors.
  • Even simple statistical equity risk models capturing a few intuitive and investable factors with robust statistics may adequately describe and predict the performance of Quality portfolios.
The information herein is not represented or warranted to be accurate, correct, complete or timely.
Past performance is no guarantee of future results.
Copyright © 2012-2016, AlphaBetaWorks, a division of Alpha Beta Analytics, LLC. All rights reserved.
Content may not be republished without express written consent.

Testing Equity Risk Models: Property and Casualty Insurance Portfolios

Equity risk models can be complex and hard to interpret. Moreover, differences in financial reporting and transparency across markets and companies can lead to inaccurate prediction for common fundamental models. Yet, when properly constructed, statistical equity risk models that capture the most salient factors built on robust statistics are highly predictive. This is especially true for US Property and Casualty (P&C) Insurance company portfolios:

  • Even a simple single-factor model delivers over 0.96 median correlation between predicted and actual monthly returns for U.S. P&C equity portfolios;
  • Sophisticated models that incorporate industry, macroeconomic, and style factors deliver over 0.97 median correlation between predicted and actual monthly returns for U.S. P&C equity portfolios.
  • The difference in predictive accuracy between a perfect model and robust statistical models cited here is at most 0.03 higher median correlation and 5% higher explained share of variance.

Property and Casualty Insurance Equity Portfolio Sample

This analysis of P&C equity portfolios resulted from collaboration with Peer Analytics, the only provider of accurate peer universe comparisons to the insurance industry. We examined historical positions, factor exposures, and returns of approximately 500 U.S. P&C Insurance equity portfolios over the past 10 years.

Quantifying Predictive Power of Equity Risk Models

We follow the approach of our earlier studies of risk model accuracy. To evaluate the predictive accuracy of an equity risk model, we compare returns predicted by past factor exposures to the subsequent portfolio performance: We calculate factor exposures using estimated holdings at the end of each month and predict the following month’s returns using these ex-ante factor exposures and ex-post factor returns.

The correlation between predicted and actual returns measures a model’s accuracy. The higher the correlation, the more effective a model is at hedging, stress testing and scenario analysis, as well as evaluating investment skill.

Testing Predictions of Single-Factor Statistical Equity Risk Models

The simplest statistical equity risk model uses a single systematic risk factor – Market Beta. Since Market Beta is the dominant risk factor, even a simple model built with robust methods delivers 0.93 mean and 0.96 median correlations between predicted and actual monthly returns:

Chart of the correlations between predicted returns constructed using a single-factor statistical equity risk model and actual historical returns for the equity portfolios of over 500 U.S. Property and Casualty Insurance Companies

U.S. Property and Casualty Insurance Equity Portfolios: Correlation between a single-factor statistical equity risk model’s predictions and actual monthly returns

  Min. 1st Qu.  Median    Mean 3rd Qu.    Max. 
0.4244  0.9146  0.9646  0.9322  0.9804  0.9973

Testing Predictions of Two-Factor Statistical Equity Risk Models

A two-factor model that adds a Sector Risk Factor, estimated with robust methods, delivers 0.95 mean and 0.97 median correlations between predicted and actual monthly returns:

Chart of the correlations between predicted returns constructed using a two-factor statistical equity risk model and actual historical returns for the equity portfolios of over 500 U.S. Property and Casualty Insurance Companies

U.S. Property and Casualty Insurance Equity Portfolios: Correlation between a two-factor statistical equity risk model’s predictions and actual monthly returns

  Min. 1st Qu.  Median    Mean 3rd Qu.    Max. 
0.4524  0.9396  0.9700  0.9466  0.9829  0.9969

Testing Predictions of Multi-Factor Statistical Equity Risk Models

With correlation between predicted and actual returns very close to 1, the benefit of additional factors is low. A perfect model would, at most, provide 0.03 higher correlation, and explain 0.0591 higher fraction of ex-post variance. In short, the benefit of highly complex models is limited and may not be worth the effort, complexity, or expense.

The AlphaBetaWorks U.S. Equity Statistical Risk Model extends the two-factor model with Style Factors (Value/Growth and Size) and Macroeconomic Factors (Bonds, Oil, Currency, etc.). It delivers 0.95 mean and 0.97 median correlations between predicted and actual monthly returns for U.S. Property and Casualty Insurance equity portfolios:

Chart of the correlations between predicted returns constructed using a multi-factor statistical equity risk model and actual historical returns for the equity portfolios of over 500 U.S. Property and Casualty Insurance Companies

U.S. Property and Casualty Insurance Equity Portfolios: Correlation between a multi-factor statistical equity risk model’s predictions and actual monthly returns

  Min. 1st Qu.  Median    Mean 3rd Qu.    Max. 
0.4622  0.9403  0.9723  0.9476  0.9839  0.9975

For the 25% P&C portfolios it handles the worst, the model still achieves 0.46-0.94 correlation between predicted and actual returns.

The sample contains outliers holding substantial bond fund positions, exotic investments, and concentrated stakes. These likely under-state models’ accuracy for a typical P&C equity portfolio – we did not alter the universe to provide the broadest possible sample and the most conservative assessment of predictive accuracy.

Summary

  • Complex equity risk models may offer no better predictions than robust statistical models with a few intuitive factors.
  • For a typical U.S. Property and Casualty Insurance equity portfolio, a robust statistical equity risk model delivers over 0.97 correlation between predicted and actual monthly returns.
  • Even a perfect equity risk model would, at most, yield 0.03 higher correlation and explain 5.1% more ex-post variance.
The information herein is not represented or warranted to be accurate, correct, complete or timely.
Past performance is no guarantee of future results.
Copyright © 2012-2015, AlphaBetaWorks, a division of Alpha Beta Analytics, LLC. All rights reserved.
Content may not be republished without express written consent.

Testing Global Equity Risk Models

Due to differences in financial reporting and transparency across international markets, fundamental company data is often unsuitable for building global risk models. Consequently, global equity risk models can be even more complex, brittle, and hard to interpret than their U.S. counterparts. Global statistical equity risk models are immune to these deficiencies in fundamental data and, when properly constructed to robustly capture the key risk factors, are highly predictive. An intuitive Global Statistical Equity Risk Model using Regional and Sector/Industry factors delivers over 0.96 correlation between predicted and reported portfolio returns for a median U.S. Equity Mutual Fund.

Predictive Power of Global Statistical Equity Risk Models

We analyze 10 years of historical positions and returns for over 3,000 non-index U.S. Equity Mutual Funds. The dataset spans domestic and international portfolios, extending our earlier test of U.S. equity risk models on domestic funds. We calculate factor exposures using estimated holdings at the end of each month and predict the next month’s performance using these ex-ante factor exposures and ex-post factor returns.

The correlation between an equity risk model’s predictions and subsequent performance illustrates the model’s power. High correlation indicates effectiveness at hedging, attributing returns to systematic sources, and evaluating manager skill. Global statistical equity risk models turn out to be even more effective than their U.S. counterparts.

Testing Predictions of Single-Factor Global Statistical Equity Risk Models

Our simplest global risk model uses a single systematic risk factor for each security – Region Beta. This factor is simply Market Beta for each of the 10 global regions such as North America, Developed Europe, and China. Since Market Beta is the dominant factor behind portfolio performance, even this simple model, when built with robust methods, delivers 0.94 mean and 0.95 median correlation between predicted and actual monthly returns:

Chart of the correlations between predicted returns constructed using a single-factor global statistical equity risk model and actual historical returns for U.S.-domiciled Global Equity Mutual Funds

Global U.S. Equity Mutual Funds: Correlation between a single-factor global statistical equity risk model’s predictions and actual monthly returns

   Min.    1st Qu. Median  Mean    3rd Qu. Max. 
   0.3881  0.9214  0.9540  0.9386  0.9758  0.9968

Testing Predictions of Two-Factor Global Statistical Equity Risk Models

We now consider a two-factor model that adds a Sector Risk Factor. Each security belongs to one of 10 sectors such as Technology, Energy, or Utilities. Market and Sector Betas, estimated with robust methods, deliver 0.95 mean and over 0.96 median correlation between predicted and actual monthly returns:

Chart of the correlations between predicted returns constructed using a two-factor global statistical equity risk model and actual historical returns for U.S.-domiciled Global Equity Mutual Funds

Global U.S. Equity Mutual Funds: Correlation between a two-factor global statistical equity risk model’s predictions and actual monthly returns

  Min.    1st Qu. Median  Mean    3rd Qu. Max. 
  0.7030  0.9380  0.9647  0.9534  0.9809  0.9976

We picked sector as the second factor since research indicates that sector/industry performance captures more systematic portfolio risk than style factors do. Performance of common style factors can generally be explained by difference in sector composition of style portfolios. In contrast, performance of sectors cannot typically be attributed to differences in style of sector portfolios.

Even for the 25% funds the two-factor model handles the worst, the correlation between predicted and actual returns is 0.70-0.94. The lower accuracy of predictions is primarily caused by hybrid and fixed-income securities that are poorly described by an equity risk model.

Summary

  • Differences in financial reporting and transparency among countries make global equity risk model construction using fundamental data challenging and the resulting models fragile.
  • For a typical global U.S. mutual fund, even a minimalist statistical equity risk model with intuitive and investable factors delivers over 0.96 correlation between predicted and actual monthly returns.
  • An equity risk model with perfect prediction would, at most, improve correlation between predicted and actual returns by 0.035 and explain 6.9% more ex-post variance.
The information herein is not represented or warranted to be accurate, correct, complete or timely.
Past performance is no guarantee of future results.
Copyright © 2012-2015, AlphaBetaWorks, a division of Alpha Beta Analytics, LLC. All rights reserved.
Content may not be republished without express written consent.

Testing Predictions of Equity Risk Models

Equity risk models can be complex and hard to interpret. Yet, when properly constructed, robust statistical equity risk models capturing just the most salient factors are highly predictive. For instance, Market and Sector/Industry factors alone deliver 0.96 median correlation between predictions of equity risk models and reported portfolio returns for U.S. Equity Mutual Funds.

Predictive Power of Statistical Equity Risk Models

We analyze historical positions and returns of approximately 3,000 non-index U.S. Equity Mutual Funds over 10 years. We calculate factor exposures using estimated holdings at the end of each month and predict next month’s performance using these ex-ante factor exposures and ex-post factor returns.

The correlation between an equity risk model’s predictions and subsequently reported fund returns illustrates the model’s power. The higher the correlation, the more effective a model is at hedging, attributing returns to systematic sources, and evaluating manager skill.

Testing Predictions of Single-Factor Statistical Equity Risk Models

The simplest statistical equity risk model uses a single systematic risk factor – Market Beta. Since Market Beta is the dominant factor behind portfolio performance, even a very simple model built with robust methods delivers 0.92 mean and 0.94 median correlation between predicted and actual monthly returns:

Chart of the correlations between predicted returns constructed using a single-factor statistical equity risk model and actual historical returns for U.S. Equity Mutual Funds

U.S. Equity Mutual Funds: Correlation between a single-factor statistical equity risk model’s predictions and actual monthly returns

  Min.    1st Qu. Median  Mean    3rd Qu. Max. 
  0.1360  0.9010  0.9401  0.9157  0.9650  0.9981

Testing Predictions of Two-Factor Statistical Equity Risk Models

Research indicates that sector/industry risk factors capture more systematic portfolio risk than style factors do. For instance, in periods such as 1999-2001 the performance of common style factors is due to difference in sector composition of style portfolios.

Thus, we consider a two-factor model that adds a Sector Risk Factor. Each security belongs to one of 10 sectors. Market and Sector Betas, estimated with robust methods delivers 0.94 mean and 0.96 median correlation between predicted and actual monthly returns:

Chart of the correlations between predicted returns constructed using a two-factor statistical equity risk model and actual historical returns for U.S. Equity Mutual Funds

U.S. Equity Mutual Funds: Correlation between a two-factor statistical equity risk model’s predictions and actual monthly returns

  Min.    1st Qu. Median  Mean    3rd Qu. Max. 
  0.6639  0.9254  0.9562  0.9420  0.9753  0.9984

Testing Predictions of Multi-Factor Statistical Equity Risk Models

With correlation between predicted and actual returns very close to 1, the benefit of increased model complexity is rapidly diminishing. Even a perfect model would, at most, provide 0.0438 higher correlation, or explain 0.0857 higher fraction of ex-post variance for most funds than the above two-factor model.

Extending the two-factor model with Style Factors (Value/Growth and Size) as well as Macroeconomic Factors (Bonds, Oil, Currency, etc.), we arrive at the AlphaBetaWorks’ U.S. Equity Statistical Risk Model. It delivers 0.95 mean and 0.96 median correlation between predicted and actual monthly returns for U.S. Equity Mutual Funds:

Chart of the correlations between predicted returns constructed using a multi-factor statistical equity risk model and actual historical returns for U.S. Equity Mutual Funds

U.S. Equity Mutual Funds: Correlation between a multi-factor statistical equity risk model’s predictions and actual monthly returns

  Min.    1st Qu. Median  Mean    3rd Qu. Max. 
  0.6661  0.9420  0.9629  0.9503  0.9766  0.9987

Even for the 25% funds it handles the worst, the model delivers 0.67-0.94 correlation between predicted and actual returns.

Summary

  • Complex equity risk models with non-intuitive factors may offer no better predictions than robust models with a few intuitive factors.
  • Even a perfect equity risk model would, at most, explain 8.6% more ex-post variance than a simple two-factor model.
  • For a typical U.S. mutual fund, a statistical equity risk model with intuitive and investable factors delivers over 0.96 correlation between predicted and actual monthly returns.
The information herein is not represented or warranted to be accurate, correct, complete or timely.
Past performance is no guarantee of future results.
Copyright © 2012-2015, AlphaBetaWorks, a division of Alpha Beta Analytics, LLC. All rights reserved.
Content may not be republished without express written consent.

Hedge Fund Industrials Factor Timing

In an earlier post, we discussed the largest bets hedge fund long portfolios were making in Q1 2015. The third largest was on the Industrials Factor. This is the risk specific to the industrials sector after controlling for market exposure. It captures capital allocation to industrials and sensitivity (beta) to the sector. There is weak statistical evidence of poor industrials factor timing by hedge funds – investors who follow hedge funds should either ignore this bet or treat it as a negative indicator.

At the end of Q1 2015, high industrials sector factor exposure was the third largest source of U.S. hedge funds’ long portfolio crowding. HF Aggregate, a portfolio consisting of popular long U.S. equity holdings of all hedge funds tractable from quarterly filings, had over 25% industrials factor exposure – a 9% overweight relative to Market. This exposure was at an all-time high:

Chart of the historical industrials factor exposure of U.S. Hedge Fund Aggregate

U.S. Hedge Fund Aggregate’s Industrials Sector Factor Exposure History

This industrials factor exposure captures sector risk after controlling for market exposure. For example, a fund with 10% allocated to a broad industrials index will have approximately 10% industrials factor exposure. A fund with 10% allocated to a 2x-levered broad industrials ETF will have approximately 20% industrials factor exposure.

Here we analyze the hedge fund industry’s skill in timing the U.S. Industrials Factor by varying this exposure. The AlphaBetaWorks Performance Analytics Platform evaluates market timing skills and performance using two related tests:

  • Statistical test for the relationship between factor exposure and subsequent factor returns,
  • Statistical test for the size and consistency of returns generated by varying factor exposures.

Hedge Fund Industrials Factor Exposure and Industrials Factor Return

We calculated the Spearman’s rank correlation coefficient of HF Aggregate’s industrials factor exposure and subsequent industrials factor return for the past 10 years and tested it for significance. The chart below illustrates the correlation between the two series and the test results:

Chart of the correlation between historical industrials factor exposure of U.S. Hedge Fund Aggregate and subsequent factor return

U.S. Hedge Fund Aggregate’s Industrials Factor Exposure and Return

There is a statistically weak negative relationship between HF Aggregate’s industrials factor exposure and subsequent factor performance. Hedge fund industrials factor exposure is a weak predictor of future industrials returns.

Hedge Fund Industrials Factor Timing Returns

Over the past 10 years, HF Aggregate (USHFS in red) made approximately 0.9% less than it would have with constant industrials factor exposure, as illustrated below. The performance of HF Aggregate is compared to all tractable 13F filers (Group in gray). The AlphaBetaWorks Performance Analytics Platform identifies this performance due to industrials factor timing as industrials βReturn:

Chart of the cumulative historical contribution of variation in industrials factor exposure of U.S. Hedge Fund Aggregate to the Aggregate’s performance

U.S. Hedge Fund Aggregate’s Industrials Factor Timing Return

The weak evidence of poor industrials factor timing by the industry, combined with the high recent industrials factor exposure, is a weak bearish indicator for the sector.

Summary

  • The industrials factor exposure of U.S. hedge funds’ long portfolios is weakly predictive of subsequent sector performance.
  • Current hedge fund industrials factor exposure, at 10-year highs, is a weak bearish indicator for the Industrials Sector.
  • Investors who track hedge fund holdings should either ignore this bet or treat is as a negative indicator.
The information herein is not represented or warranted to be accurate, correct, complete or timely.
Past performance is no guarantee of future results.
Copyright © 2012-2015, AlphaBetaWorks, a division of Alpha Beta Analytics, LLC. All rights reserved.
Content may not be republished without express written consent.

Hedge Fund Oil Factor Timing

In an earlier post, we discussed the largest bets hedge fund long portfolios were making in Q1 2015. The second largest was on the oil price. This exposure is the residual oil price risk after controlling for market and sector exposures. It captures overweighting within various sectors of companies that out- or underperform under rising oil price. There is weak statistical evidence of skilled oil factor timing by hedge funds – the current bet is a weak bullish indicator for oil prices.

At the end of Q1 2015, high oil price factor exposure was the second largest source of U.S. hedge funds’ long portfolio crowding. HF Aggregate, a portfolio consisting of popular long U.S. equity holdings of all hedge funds tractable from quarterly filings, had approximately 2.5% oil price factor exposure. This exposure was approaching the 10-year highs reached in 2007-2009:

Chart of the exposure of oil price factor of the U.S. Hedge Fund Aggregate

U.S. Hedge Fund Aggregate’s Oil Factor Exposure History

This oil price exposure captures residual oil risk after controlling for sector exposures. For examples, airlines with higher operational or financial leverage than peers have negative oil price factor exposure – they will underperform peers when oil price increases; airlines with lower operational or financial leverage than peers have positive oil price factor exposure –they will outperform peers when oil price increases.

Here we analyze the hedge fund industry’s skill in timing the oil price by varying this intra-sector oil price risk. The AlphaBetaWorks Performance Analytics Platform evaluates market timing skills and performance using two related tests:

  • Statistical test for the relationship between factor exposure and subsequent factor returns,
  • Statistical test for the size and consistency of returns generated by varying factor exposures.

Hedge Fund Oil Factor Exposure and Oil Return

We calculated the Spearman’s rank correlation coefficient of HF Aggregate’s oil price factor exposure and subsequent oil price return and tested it for significance. The chart below illustrates the correlation between the two series and the test results:

Chart of the correlation between oil price factor exposure of the U.S. Hedge Fund Aggregate and subsequent oil price return

U.S. Hedge Fund Aggregate’s Oil Factor Exposure and Return

There is a statistically weak positive relationship between HF Aggregate’s oil factor exposure and subsequent oil performance. Hedge fund oil factor exposure is a weak indicator of future oil price direction.

Hedge Fund Oil Factor Timing Returns

Over the past 10 years, HF Aggregate (USHFS in red) made approximately 1.5% more than it would have with constant oil factor exposure, as illustrated below. The performance of HF Aggregate is compared to all tractable 13F filers (Group in gray). The AlphaBetaWorks Performance Analytics Platform identifies this performance due to oil price factor timing as oil price βReturn:

Chart of the return due to variation in oil price factor exposure of the U.S. Hedge Fund Aggregate

U.S. Hedge Fund Aggregate’s Oil Factor Timing Return

The weak evidence of oil factor timing skill by the industry, combined with the high recent oil factor exposure, is a weak bullish indicator for oil prices.

Summary

  • The oil price factor exposure of U.S. hedge funds’ long portfolios is weakly predictive of subsequent oil performance.
  • Current hedge fund oil factor exposure, near 10-year highs, is a weak bullish indicator for oil prices.
The information herein is not represented or warranted to be accurate, correct, complete or timely.
Past performance is no guarantee of future results.
Copyright © 2012-2015, AlphaBetaWorks, a division of Alpha Beta Analytics, LLC. All rights reserved.
Content may not be republished without express written consent.

Hedge Fund U.S. Market Timing

The single largest bet hedge fund long portfolios were making in Q1 2015 was on the U.S. market (high beta). While the bet is exceptionally large, it is not predictive of market direction. Allocators should pay attention to this risk aggregation.

At the end of Q1 2015, high market factor exposure (high beta) was the primary source of U.S. hedge funds’ long portfolio crowding. HF Aggregate, a portfolio consisting of popular long U.S. equity holdings of all hedge funds tractable from quarterly filings, had approximately 115% U.S. market factor exposure (1.15 U.S. market beta). This exposure was at 10-year highs – the level last seen in mid-2006:

Chart of the historical U.S. Market Factor exposure of U.S. Hedge Fund Aggregate

U.S. Hedge Fund Aggregate’s U.S. Market Factor Exposure History

Our work on hedge fund crowding has so far not addressed hedge fund factor timing and hedge fund U.S. market timing specifically. We dive into this performance here.

The AlphaBetaWorks Performance Analytics Platform evaluates market timing skills and performance using two related tests:

  • Statistical test for the relationship between factor exposure and subsequent factor returns,
  • Statistical test for the size and consistency of returns generated by varying factor exposures.

Hedge Fund Market Exposure and Market Return

We calculated the Spearman’s rank correlation coefficient of HF Aggregate’s market exposure and subsequent market return and tested it for significance. The chart below illustrates the correlation between the two series and the test results:

Chart of the correlation between the U.S. market exposure of long U.S. hedge fund equity portfolios and U.S. market return

U.S. Hedge Fund Aggregate’s U.S. Market Exposure and Return

The chart shows that there is a positive relationship between HF Aggregate’s U.S. market exposure and subsequent U.S. market return, but it is weak and statistically insignificant. In other words, hedge funds’ variation in U.S. market exposure has done little to help their performance.

Hedge Fund U.S. Market Timing Returns

Over the past 10 years, HF Aggregate (USHFS in red) made approximately 1% more than it would have with constant factor exposures, as illustrated below. The performance of HF Aggregate is compared to all tractable 13F filers (Group in gray). The AlphaBetaWorks Performance Analytics Platform identifies this performance due to U.S. market factor timing as U.S. market βReturn:

Chart of the historical return due to variation in U.S. market exposure of long U.S. hedge fund equity portfolios

U.S. Hedge Fund Aggregate’s U.S. Market Timing Return

The performance impact of this variation in beta within U.S. hedge fund long portfolios is also minor. However, the group of all 13F filers was a poor market timer, particularly during the volatility of 2008-2009. During the crisis, non-filers were the smart money and took advantage of U.S. market volatility, at the expense of 13F filers. 13F filers were a contrarian indicator.

Summary

  • Hedge fund long equity portfolios consistently take 5-15% more market risk than S&P500 and other broad market benchmarks.
  • There has been no statistically significant relationship between U.S. market exposure (market beta) of U.S. hedge funds’ long portfolios and subsequent market return.
  • The high market factor exposure of U.S. hedge funds’ long portfolios is not predictive of subsequent market returns.
  • The broader group of all 13F filers generated significant negative returns by varying market exposure, particularly during the 2008-2009 volatility.
The information herein is not represented or warranted to be accurate, correct, complete or timely.
Past performance is no guarantee of future results.
Copyright © 2012-2015, AlphaBetaWorks, a division of Alpha Beta Analytics, LLC. All rights reserved.
Content may not be republished without express written consent.