Due to differences in financial reporting and transparency across international markets, fundamental company data is often unsuitable for building global risk models. Consequently, global equity risk models can be even more complex, brittle, and hard to interpret than their U.S. counterparts. Global statistical equity risk models are immune to these deficiencies in fundamental data and, when properly constructed to robustly capture the key risk factors, are highly predictive. An intuitive Global Statistical Equity Risk Model using Regional and Sector/Industry factors delivers over 0.96 correlation between predicted and reported portfolio returns for a median U.S. Equity Mutual Fund.
Predictive Power of Global Statistical Equity Risk Models
We analyze 10 years of historical positions and returns for over 3,000 non-index U.S. Equity Mutual Funds. The dataset spans domestic and international portfolios, extending our earlier test of U.S. equity risk models on domestic funds. We calculate factor exposures using estimated holdings at the end of each month and predict the next month’s performance using these ex-ante factor exposures and ex-post factor returns.
The correlation between an equity risk model’s predictions and subsequent performance illustrates the model’s power. High correlation indicates effectiveness at hedging, attributing returns to systematic sources, and evaluating manager skill. Global statistical equity risk models turn out to be even more effective than their U.S. counterparts.
Testing Predictions of Single-Factor Global Statistical Equity Risk Models
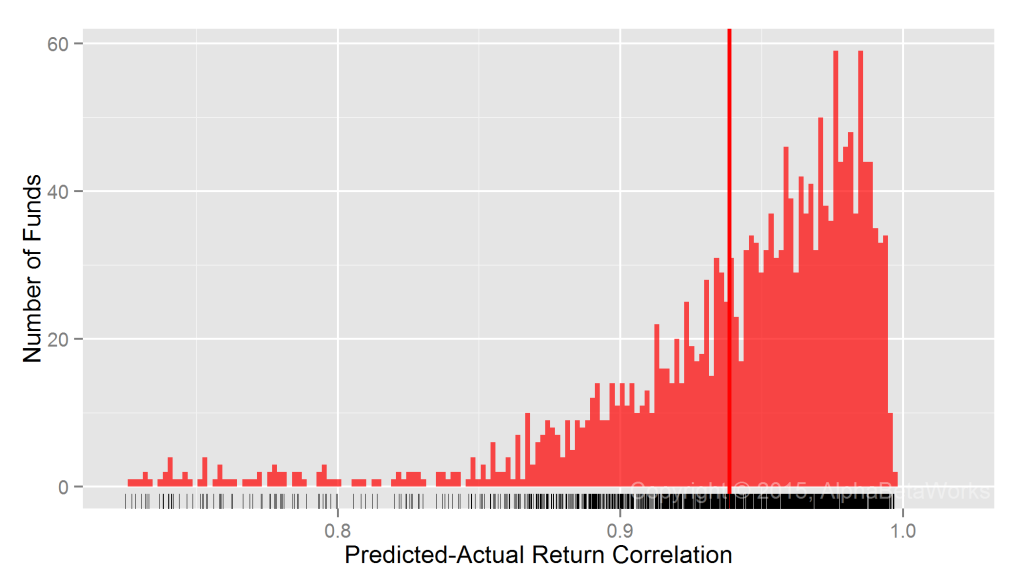
Our simplest global risk model uses a single systematic risk factor for each security – Region Beta. This factor is simply Market Beta for each of the 10 global regions such as North America, Developed Europe, and China. Since Market Beta is the dominant factor behind portfolio performance, even this simple model, when built with robust methods, delivers 0.94 mean and 0.95 median correlation between predicted and actual monthly returns:

Global U.S. Equity Mutual Funds: Correlation between a single-factor global statistical equity risk model’s predictions and actual monthly returns
   Min.    1st Qu. Median  Mean    3rd Qu. Max.
   0.3881  0.9214  0.9540  0.9386  0.9758  0.9968
Testing Predictions of Two-Factor Global Statistical Equity Risk Models
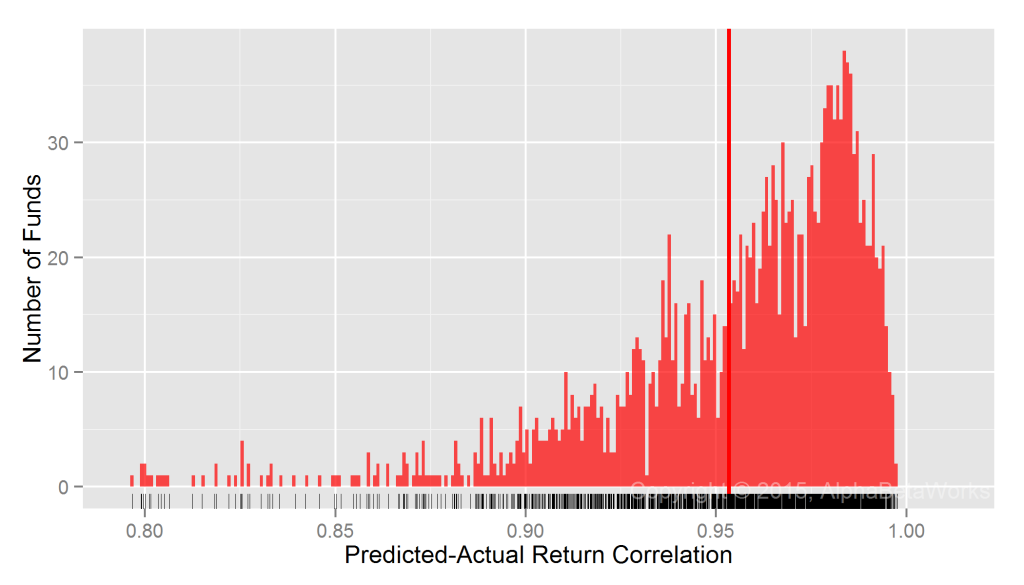
We now consider a two-factor model that adds a Sector Risk Factor. Each security belongs to one of 10 sectors such as Technology, Energy, or Utilities. Market and Sector Betas, estimated with robust methods, deliver 0.95 mean and over 0.96 median correlation between predicted and actual monthly returns:

Global U.S. Equity Mutual Funds: Correlation between a two-factor global statistical equity risk model’s predictions and actual monthly returns
  Min.    1st Qu. Median  Mean    3rd Qu. Max.
  0.7030  0.9380  0.9647  0.9534  0.9809  0.9976
We picked sector as the second factor since research indicates that sector/industry performance captures more systematic portfolio risk than style factors do. Performance of common style factors can generally be explained by difference in sector composition of style portfolios. In contrast, performance of sectors cannot typically be attributed to differences in style of sector portfolios.
Even for the 25% funds the two-factor model handles the worst, the correlation between predicted and actual returns is 0.70-0.94. The lower accuracy of predictions is primarily caused by hybrid and fixed-income securities that are poorly described by an equity risk model.
Summary
- Differences in financial reporting and transparency among countries make global equity risk model construction using fundamental data challenging and the resulting models fragile.
- For a typical global U.S. mutual fund, even a minimalist statistical equity risk model with intuitive and investable factors delivers over 0.96 correlation between predicted and actual monthly returns.
- An equity risk model with perfect prediction would, at most, improve correlation between predicted and actual returns by 0.035 and explain 6.9% more ex-post variance.


