
Berkshire’s Recent Exposure and Performance Raise Questions
There is a good reason many investors consider Berkshire Hathaway the paragon of investment success. For over 20 years, Berkshire’s equity portfolio has outperformed the general market on a risk-adjusted basis. But, in the past two years Berkshire’s alpha has turned negative. We identify the principal culprit and provide evidence of style drift at Berkshire – either by Warren Buffett or one of his possible successors.
Berkshire Hathaway Security Selection Return
Below is a chart showing Berkshire’s long equity portfolio performance since 2006, during which time it gained 108%. Many investors and guru-followers will dig no further. But simplistic analysis produces dangerous conclusions. Much of Berkshire’s performance—and that of most stocks—can be attributed to systematic sources, or factors. Berkshire’s nominal performance is influenced by the Market, bond rates, and FX rates. Since factor returns revert, and nominal returns are a contrarian indicator of future performance, it is important to separate Berkshire’s factor performance from its stock-picking skill.
We use the AlphaBetaWorks Statistical Equity Risk Model to analyze Berkshire’s equity portfolio since 2006. The chart below shows Berkshire returns due to systematic (factor) and idiosyncratic (stock selection, alpha) components.
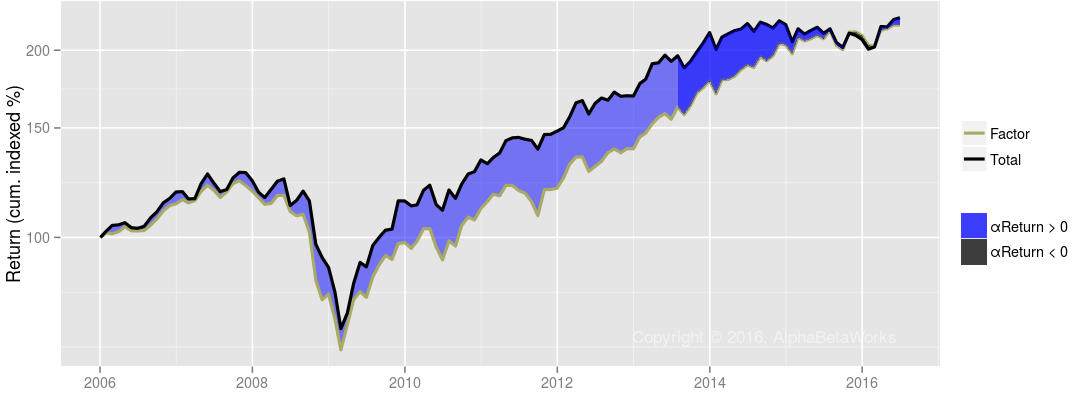
Berkshire Hathaway Long Equity Portfolio Performance – Factor and Stock Selection Components
In the chart above, the black line represents Berkshire’s long equity portfolio total return. Within this, the gray line is performance due to factors, and the blue area reflects Berkshire’s positive returns from stock selection, or αReturn. Since “alpha” and security selection performance are widely and often inconsistently used, AlphaBetaWorks defines a rigorous metric of security selection performance as αReturn, which is performance net of all factor effects, or the return a portfolio would have generated if markets were flat.
From 2006 to 2013 Berkshire’s return from stock selection alone was +29.9%. But in 2014 Berkshire’s αReturn started to decline (thinning blue area). Between 2014 and 2015, Berkshire’s return from stock selection was -16.3%.
Whereas the chart above depicts Berkshire αReturn including factor returns, the chart below depicts Berkshire’s ten-year αReturn in isolation.
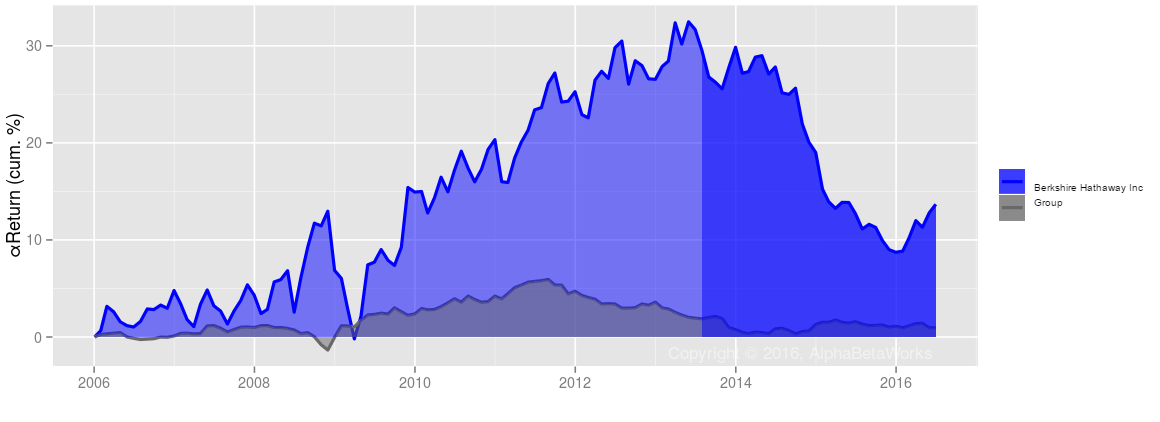
Berkshire Hathaway Return from Stock Selection (αReturn)
Berkshire’s αReturn began to decay in 2014. There is one principal sector responsible for this: Technology.
Berkshire Hathaway Technology Exposure
Berkshire made a significant bet in the technology sector in mid-2011 after having avoided it for a very long time:
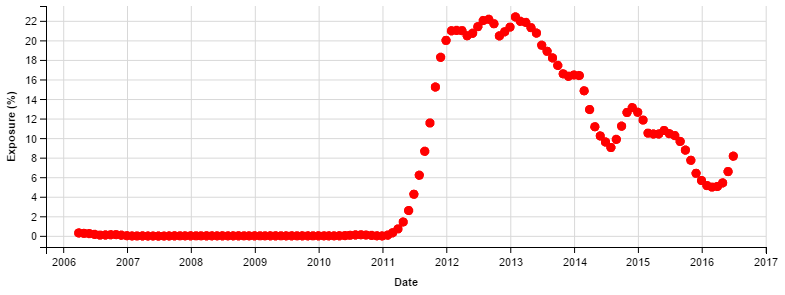
Berkshire Hathaway Long Equity Factor Exposure – Technology
From 2006 to 2011, Berkshire’s technology exposure was effectively zero. But starting in 2011 it went up dramatically.
Berkshire Hathaway Technology Security Selection
This bet has gone poorly. In fact, this sector is the principal contributor to Berkshire’s recent αReturn decay:
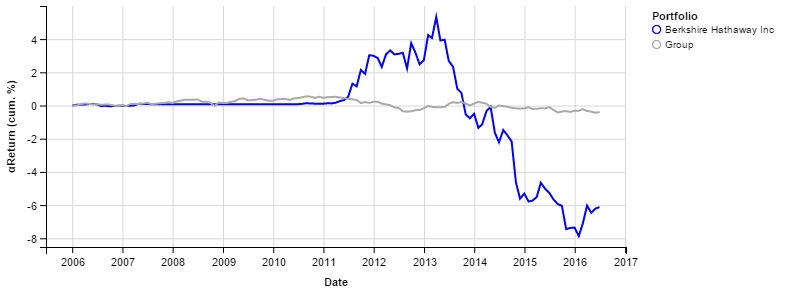
Berkshire Hathaway Return from Stock Selection (αReturn) – Technology Sector
Berkshire’s long equity portfolio suffered over a 12% loss from technology stock selection, peak-to-trough.
Style Drift, Succession Issues?
Warren Buffett has long been very public about his avoidance of technology investments, citing reluctance to allocate capital to a business he cannot understand. So why was a manager with no record in, and known skepticism towards, the technology industry making large bets in it? In this light, the above data indicates worrying style drift. Perhaps this large technology sector bet was made by one of his likely successors, which raises an equally important question about manager succession and the style drift risk therein: does a new portfolio manager demonstrate security selection skill (positive αReturn) in general, and in the areas of growing allocation like technology? And what other changes should investors expect of new leadership?
Whether Berkshire’s recent negative αReturn is Buffett’s own error or commission or a byproduct of portfolio manager transition is beyond the scope of this piece. Our focus is identifying active return, its sources (factor timing, stock selection), and their predictive value. All of the above lead to improved performance. In Berkshire’s case, our approach has identified that an established star manager shifted focus to an area previously avoided (technology), and that this shift reduced stock selection performance. Whatever the reason, the results are troublesome. Their early warnings are critical to investors’ and managers’ performance.
Such analysis of risk and performance using holdings data and a predictive equity risk model provides indicators that enhance manager/fund selection and future performance. It can also highlight emerging issues, such as style drift.
Summary
- After a long, positive run, Berkshire Hathaway’s stock selection returns (alpha) turned negative in 2014.
- Berkshire’s allocation to the technology sector was the principal driver behind its recent negative alpha.
- Whether by Buffett or someone new, style drift is a cause of Berkshire’s increased allocation to technology and the resulting negative alpha.
- Even when investing in or alongside star managers, it is critical that investors and allocators rely on robust and predictive tools to detect early signs of style drift and stock selection decay.


