
It is common to augment risk models with numerous interrelated factors. This causes problems: Size, Value, Quality, Volatility, and their kin have much in common. At best, overzealous addition of related factors leads to unnecessarily bloated models. At worst, it leads to overfitting, multicollinearity, and questionable statistical analysis.
Fortunately, most complex factors derive virtually all of their volatility and performance from more basic ones such as Market, Sectors, and Size. Therefore, simple statistical equity risk models that capture a few intuitive investable factors with robust statistics usually suffice to describe and predict the performance of investable portfolios of more complex factors. We illustrate this with a popular Quality Factor ETF.
Attributing the Performance of a Quality ETF to Simpler Factors
We analyzed a popular Quality ETF using the AlphaBetaWorks Statistical Equity Risk Model – a proven tool for forecasting portfolio risk and performance. We estimated monthly positions from regulatory filings and aggregated positions’ factor (systematic) exposures. This produced a series of monthly portfolio exposures to simple investable risk factors such as Market, Sector, and Size. The factor exposures and subsequent factor returns were used to calculate future residual (security-selection, idiosyncratic, stock-specific) returns un-attributable to these simple investable factors.
iShares MSCI USA Quality Factor (QUAL): Performance Attribution
We used iShares MSCI USA Quality Factor (QUAL) as an example of a practical implementation of a quality factor portfolio. QUAL is a $1.7bil ETF that seeks to track an index of U.S. large- and mid-cap stocks with high return on equity, high earnings variability, and low debt-to-equity ratio.
iShares MSCI USA Quality Factor (QUAL): Factor Exposures
The following non-Quality factors are responsible for most of the historical returns and variance of QUAL within the parsimonious statistical equity risk model used:
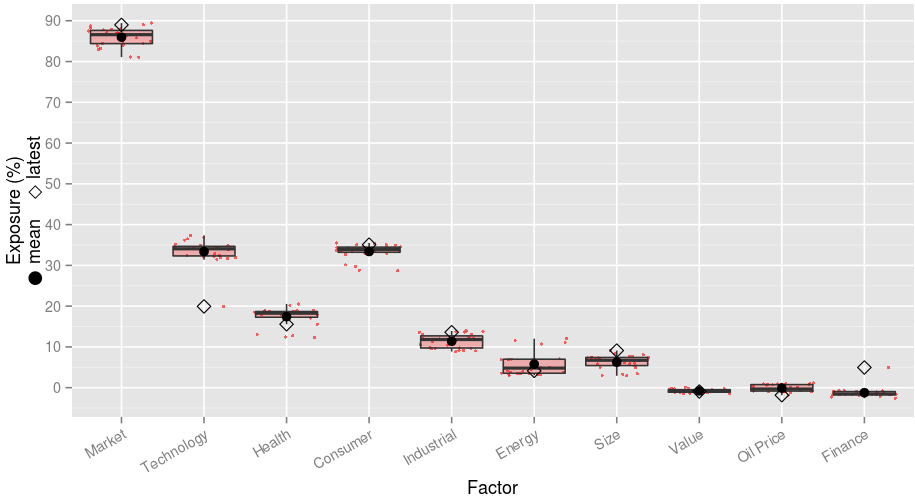
iShares MSCI USA Quality Factor (QUAL): Significant Historical Factor Exposures
| Latest | Mean | Min. | Max. | |
| Market | 88.99 | 85.98 | 81.07 | 89.44 |
| Technology | 19.93 | 33.39 | 19.93 | 37.35 |
| Health | 15.56 | 17.44 | 12.34 | 20.54 |
| Consumer | 35.08 | 33.41 | 28.70 | 35.50 |
| Industrial | 13.60 | 11.40 | 8.86 | 13.92 |
| Energy | 4.14 | 5.76 | 3.05 | 12.02 |
| Size | 9.11 | 6.27 | 2.91 | 9.11 |
| Value | -0.93 | -0.78 | -1.54 | 0.10 |
| Oil Price | -1.83 | -0.09 | -1.83 | 1.17 |
| Finance | 4.95 | -1.22 | -2.57 | 4.95 |
For instance, since Quality companies tend to be larger, some of QUAL’s performance is due to its long exposure to the Size Factor (overweighting of stocks that behave like large-capitalization companies):
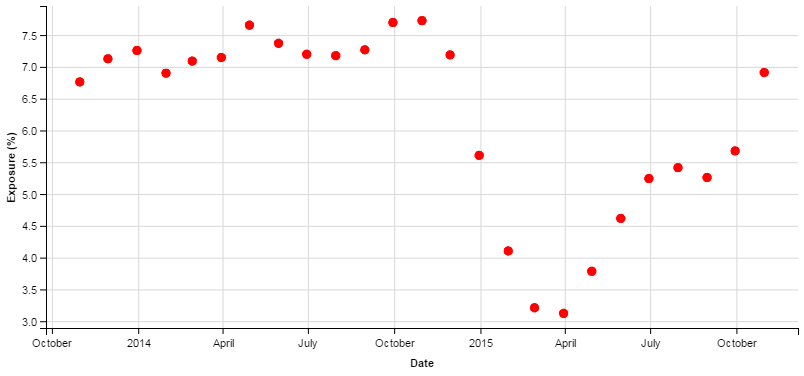
iShares MSCI USA Quality Factor (QUAL): Historical Size Factor Exposures
iShares MSCI USA Quality Factor (QUAL): Active Return
To replicate QUAL with simple non-momentum factors, one can use a passive portfolio of these simple non-momentum factors with QUAL’s mean exposures to them as weights. This portfolio defined the Passive Return in the following chart. Active return, or αβReturn, is the performance in excess of this passive replicating portfolio. It in turn is the sum of active return from residual stock-specific performance (αReturn) and active return from variation in factor exposures, or factor timing (βReturn):
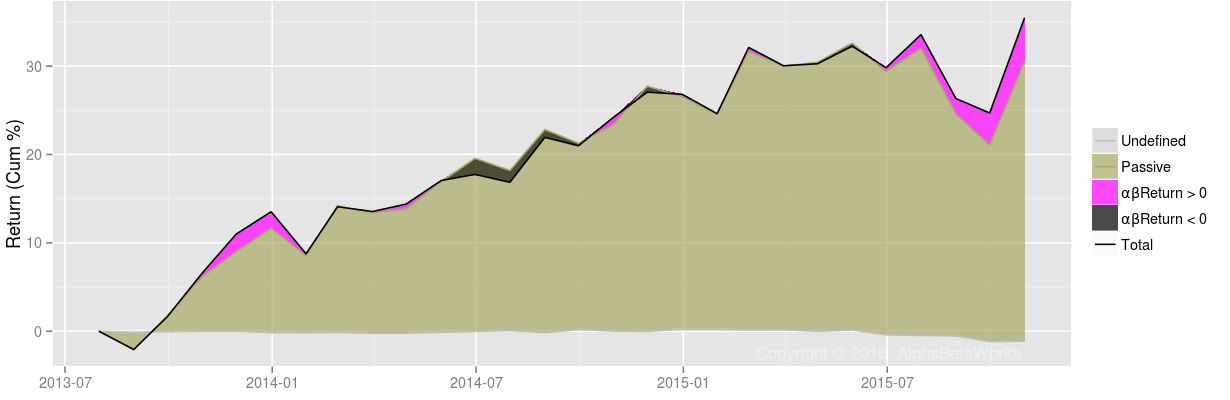
iShares MSCI USA Quality Factor (QUAL): Cumulative Passive and Active Returns
QUAL’s performance closely tracks the passive replicating portfolio. Pearson’s correlation between Total Return and Passive Return is 0.97 – 94% of the variance of monthly returns is attributable to passive factor exposures, primarily to Market, Sector, and Size factors. Active return – performance due to idiosyncratic Quality effects rather than simpler factors – is negligible. Even without a factor to identify quality, the model comprehensively captures the risk and performance of QUAL.
QUAL offers convenient and cheap exposure to quality companies. We cite it here as an example of the reduction of the Quality Factor to simpler non-Quality factors. More elaborate, non-transparent, and expensive smart beta strategies can be hazardous. Many “smart beta” funds are merely high-beta and offer no value over portfolios of conventional dumb-beta funds. It is thus vital to test any new resident of the Factor Zoo to determine whether they are merely exotic breeds of its more boring residents.
Conclusion
- Investable portfolios based on complex factors such as Quality, tend to derive virtually all of their volatility and performance from more basic factors, such as Market, Sectors, and Size.
- A popular Quality ETF, iShares MSCI USA Quality Factor (QUAL), has had 0.97 correlation with a passive replicating portfolio of basic non-quality factors.
- Even simple statistical equity risk models capturing a few intuitive and investable factors with robust statistics may adequately describe and predict the performance of Quality portfolios.


