In an earlier post, we discussed the largest bets hedge fund long portfolios were making in Q1 2015. The second largest was on the oil price. This exposure is the residual oil price risk after controlling for market and sector exposures. It captures overweighting within various sectors of companies that out- or underperform under rising oil price. There is weak statistical evidence of skilled oil factor timing by hedge funds – the current bet is a weak bullish indicator for oil prices.
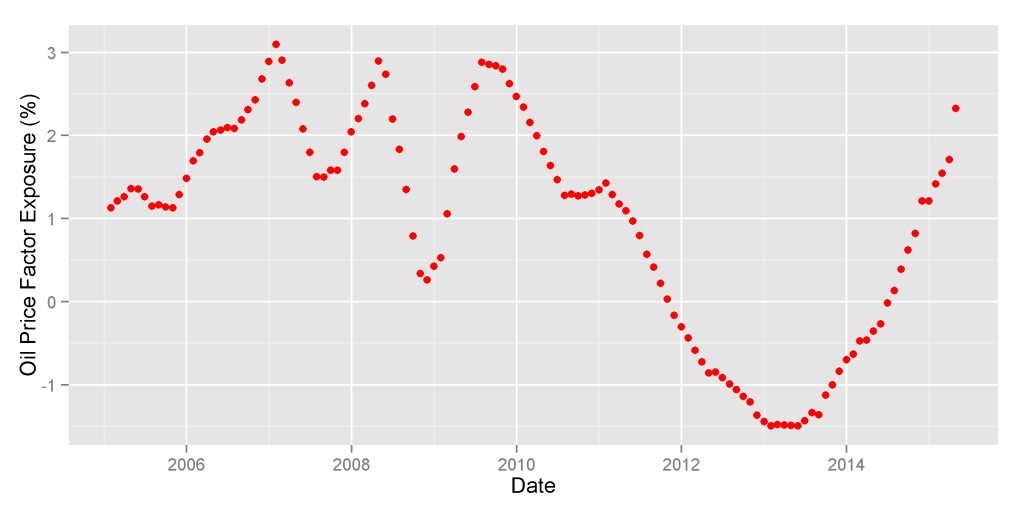
At the end of Q1 2015, high oil price factor exposure was the second largest source of U.S. hedge funds’ long portfolio crowding. HF Aggregate, a portfolio consisting of popular long U.S. equity holdings of all hedge funds tractable from quarterly filings, had approximately 2.5% oil price factor exposure. This exposure was approaching the 10-year highs reached in 2007-2009:
This oil price exposure captures residual oil risk after controlling for sector exposures. For examples, airlines with higher operational or financial leverage than peers have negative oil price factor exposure – they will underperform peers when oil price increases; airlines with lower operational or financial leverage than peers have positive oil price factor exposure –they will outperform peers when oil price increases.
Here we analyze the hedge fund industry’s skill in timing the oil price by varying this intra-sector oil price risk. The AlphaBetaWorks Performance Analytics Platform evaluates market timing skills and performance using two related tests:
- Statistical test for the relationship between factor exposure and subsequent factor returns,
- Statistical test for the size and consistency of returns generated by varying factor exposures.
Hedge Fund Oil Factor Exposure and Oil Return
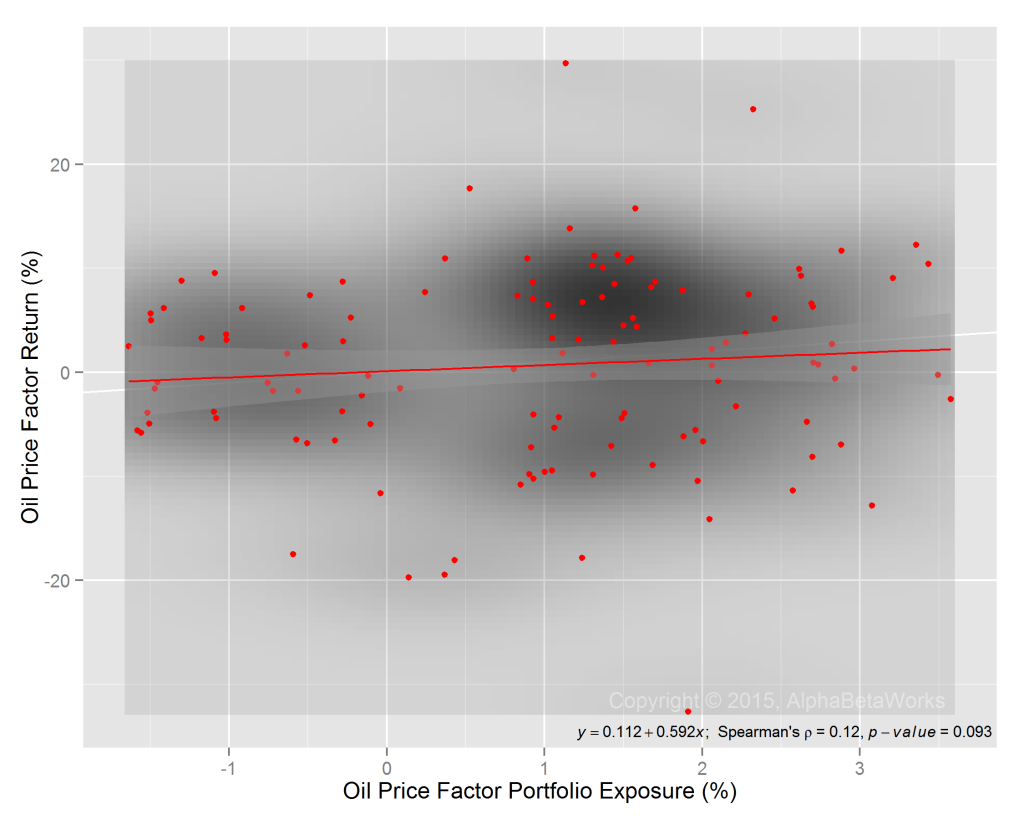
We calculated the Spearman’s rank correlation coefficient of HF Aggregate’s oil price factor exposure and subsequent oil price return and tested it for significance. The chart below illustrates the correlation between the two series and the test results:
There is a statistically weak positive relationship between HF Aggregate’s oil factor exposure and subsequent oil performance. Hedge fund oil factor exposure is a weak indicator of future oil price direction.
Hedge Fund Oil Factor Timing Returns
Over the past 10 years, HF Aggregate (USHFS in red) made approximately 1.5% more than it would have with constant oil factor exposure, as illustrated below. The performance of HF Aggregate is compared to all tractable 13F filers (Group in gray). The AlphaBetaWorks Performance Analytics Platform identifies this performance due to oil price factor timing as oil price βReturn:
The weak evidence of oil factor timing skill by the industry, combined with the high recent oil factor exposure, is a weak bullish indicator for oil prices.
Summary
- The oil price factor exposure of U.S. hedge funds’ long portfolios is weakly predictive of subsequent oil performance.
- Current hedge fund oil factor exposure, near 10-year highs, is a weak bullish indicator for oil prices.


