
Hedge fund replication, tracking, and analysis often focus on the individual positions and on the stock-specific risk they contribute. This overlooks the far more important return source – systematic hedge fund volatility. A statistical equity risk model that robustly captures exposures to the key systematic risk factors delivers 0.92 (92%) correlation between predicted and actual returns for most hedge fund long equity portfolios reported in regulatory filings. It follows that risk, performance, and crowding of these portfolios are overwhelmingly systematic. These systematic returns can be replicated and hedged with models built on investable factors and with passive investments that track these factors. Fixation on individual holdings and position overlap is misguided at best and dangerous at worst.
U.S. Hedge Fund Equity Portfolio Sample
Our analysis covers approximately 300 U.S. hedge fund long equity portfolios active over the past 15 years. We started with the universe of over 1,000 funds. First, we eliminated half that were not analyzable from regulatory filings (primarily because of high turnover). We then eliminated the portfolios that had less than five years of contiguous history or fewer than five equity positions during a period.
Our conclusions apply to most hedge fund long equity portfolios, though high turnover funds will require higher frequency of position data for predictive return forecasts. By extension, these findings also apply to long-biased hedge funds that derive most of their performance from their long portfolios. They apply to short books as well: our experience shows that short hedge fund books tend to be even more diversified and hence even more governed by their systematic exposures (possibly due to managers’ sensitivity to stock-specific risk). Finally, systematic volatility is even higher for funds of hedge funds due to their higher diversification.
Testing the Predictive Power of Equity Risk Models for Hedge Funds
To quantify the share of systematic hedge fund volatility, we need to test the ability of an equity risk model to predict future hedge fund returns. We followed the approach of our earlier studies of equity risk models’ predictive power:
- Calculated factor exposures from the estimated holdings at the end of each month and the holdings’ factor exposures;
- Predicted the following month’s returns using these ex-ante factor exposures and ex-post factor returns;
- Compared returns predicted by past factor exposures to subsequent portfolio performance and evaluated the predictive accuracy of a model.
The correlation between predicted and actual returns measures a model’s accuracy and determines the fraction of systematic hedge fund volatility as defined by the model. The higher the correlation, the more effective a model is at hedging, stress testing, replication, and evaluating investment skill.
Systematic Hedge Fund Volatility within a Single-Factor Statistical Equity Risk Model
The simplest statistical equity risk model uses a single systematic risk factor – Market Beta. Since Market Beta is the dominant risk factor, even a simple model built with robust statistical methods delivers 0.87 mean and 0.90 median correlations between predicted and actual monthly returns:
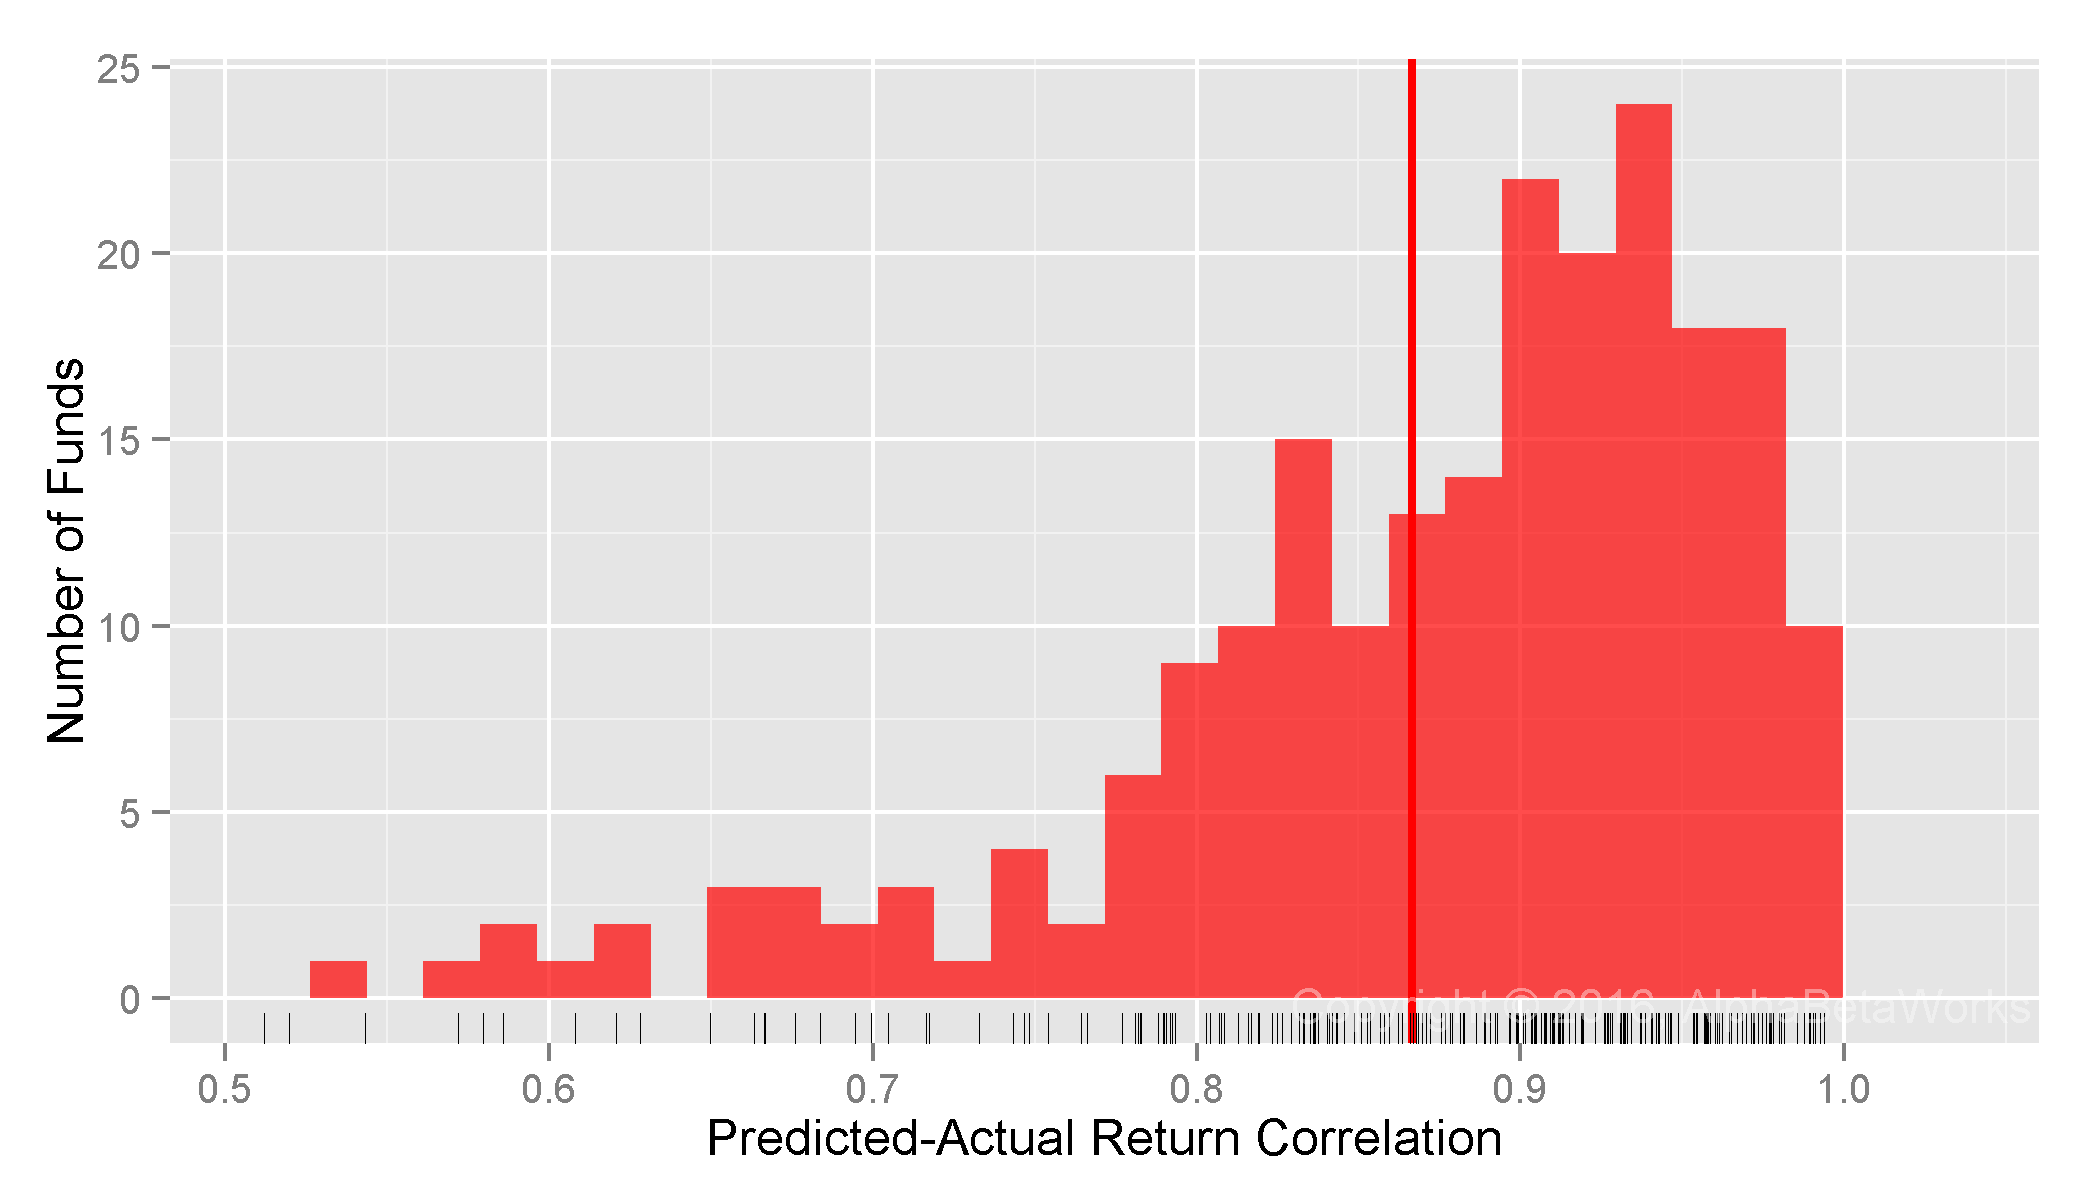
U.S. Hedge Fund Long Equity Portfolios: Correlation between a single-factor statistical equity risk model’s predictions and actual monthly returns
  Min. 1st Qu.  Median    Mean 3rd Qu.    Max.
0.2924  0.8251  0.8978  0.8665  0.9420  0.9938
Within this model, 81% of hedge fund variance is systematic.
Systematic Hedge Fund Volatility within a Two-Factor Statistical Equity Risk Model
A two-factor model that adds Sector Risk Factors, estimated with robust methods, delivers 0.89 mean and 0.92 median correlations between predicted and actual monthly returns:
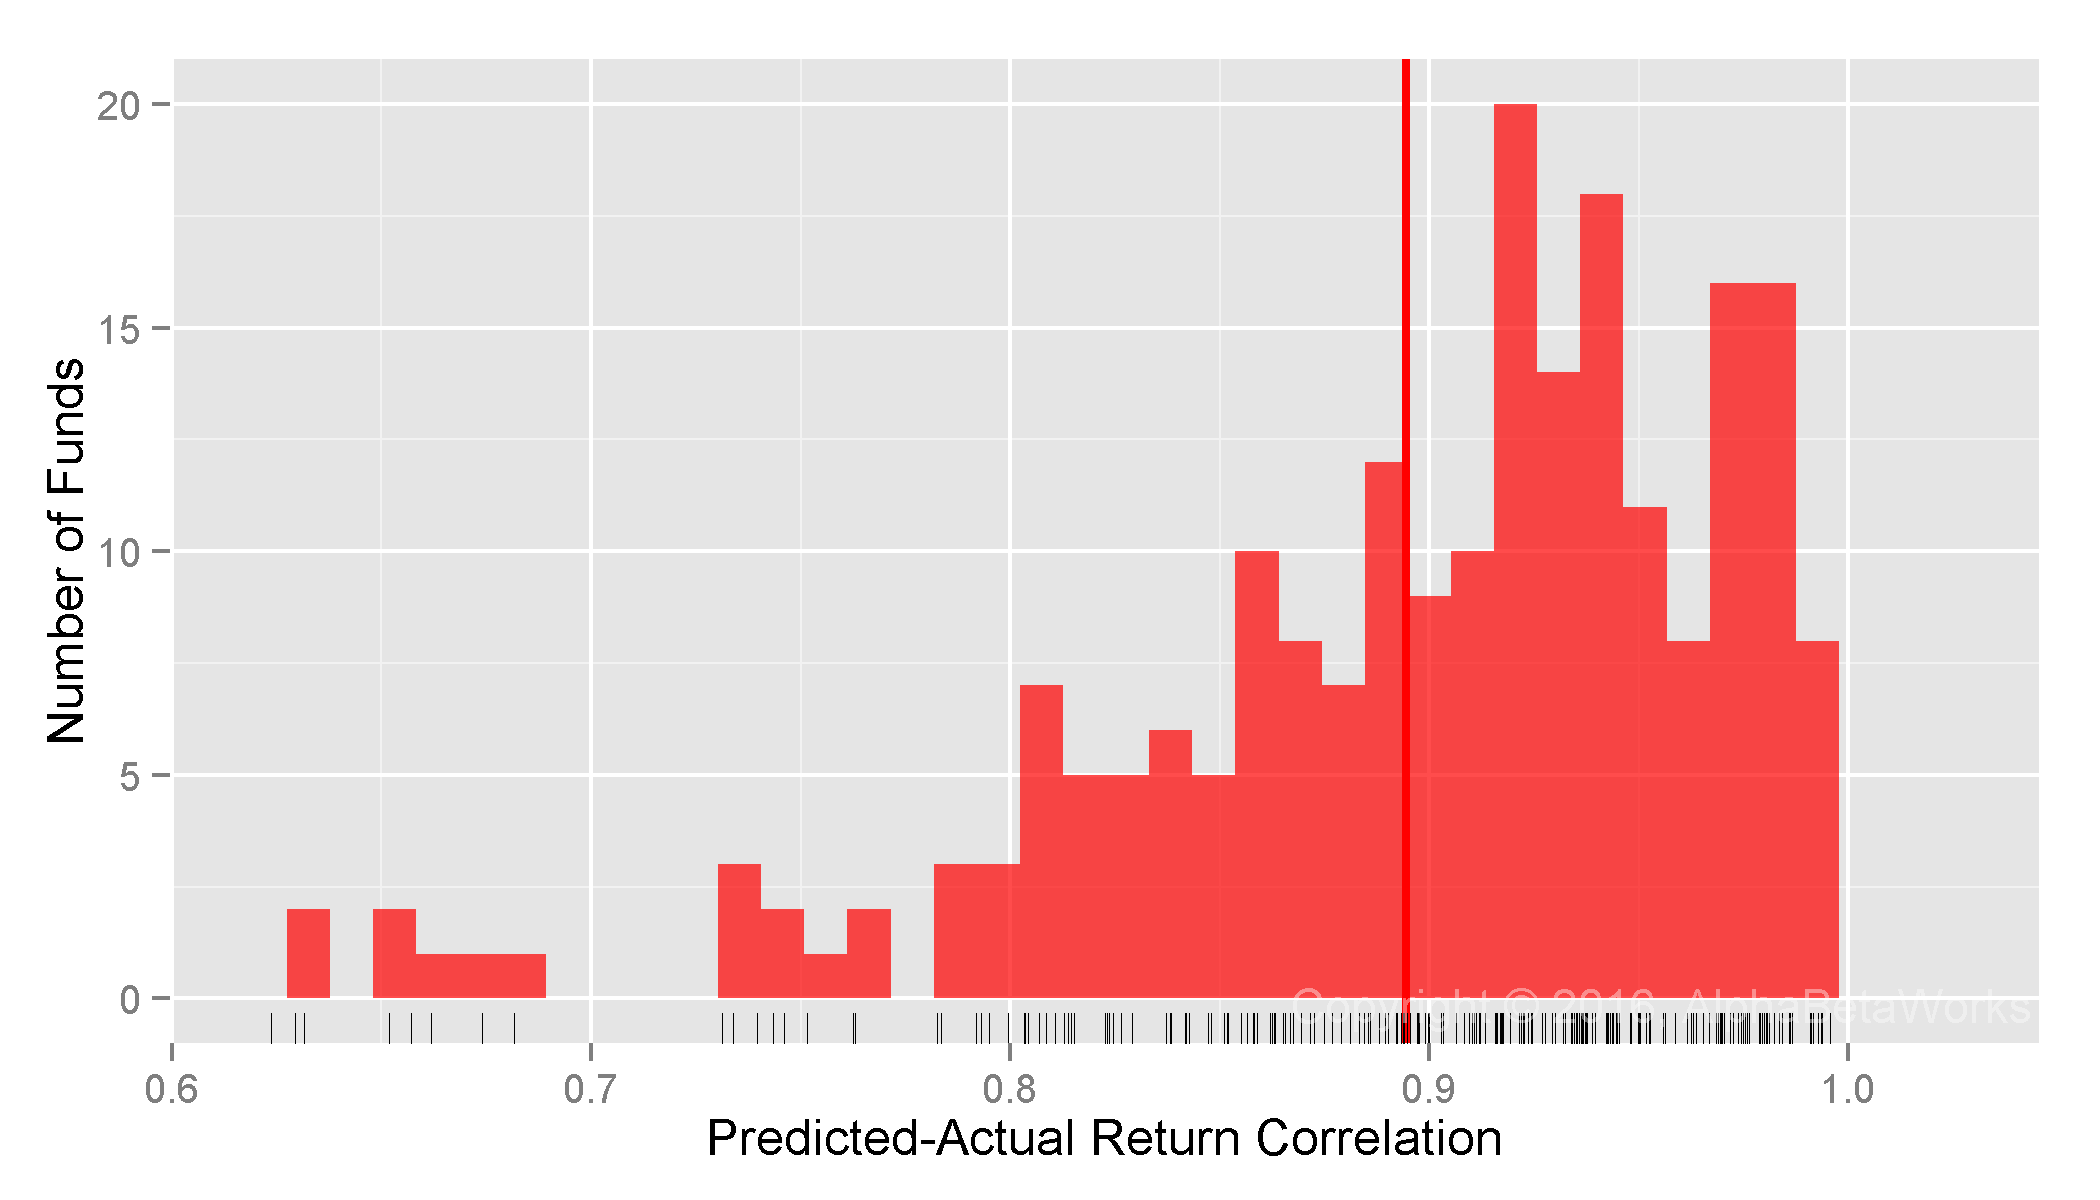
U.S. Hedge Fund Long Equity Portfolios: Correlation between a two-factor statistical equity risk model’s predictions and actual monthly returns
  Min. 1st Qu.  Median    Mean 3rd Qu.    Max.
0.5843  0.8584  0.9159  0.8946  0.9502  0.9957
Systematic Hedge Fund Volatility within a Multi-Factor Statistical Equity Risk Model
The standard AlphaBetaWorks U.S. Equity Statistical Risk Model extends the two-factor model with Style Factors (Value/Growth and Size) and Macroeconomic Factors (Bonds, Oil, Currency, etc.). This expanded model delivers 0.90 mean and 0.92 median correlations between predicted and actual monthly returns for U.S. hedge fund long equity portfolios:
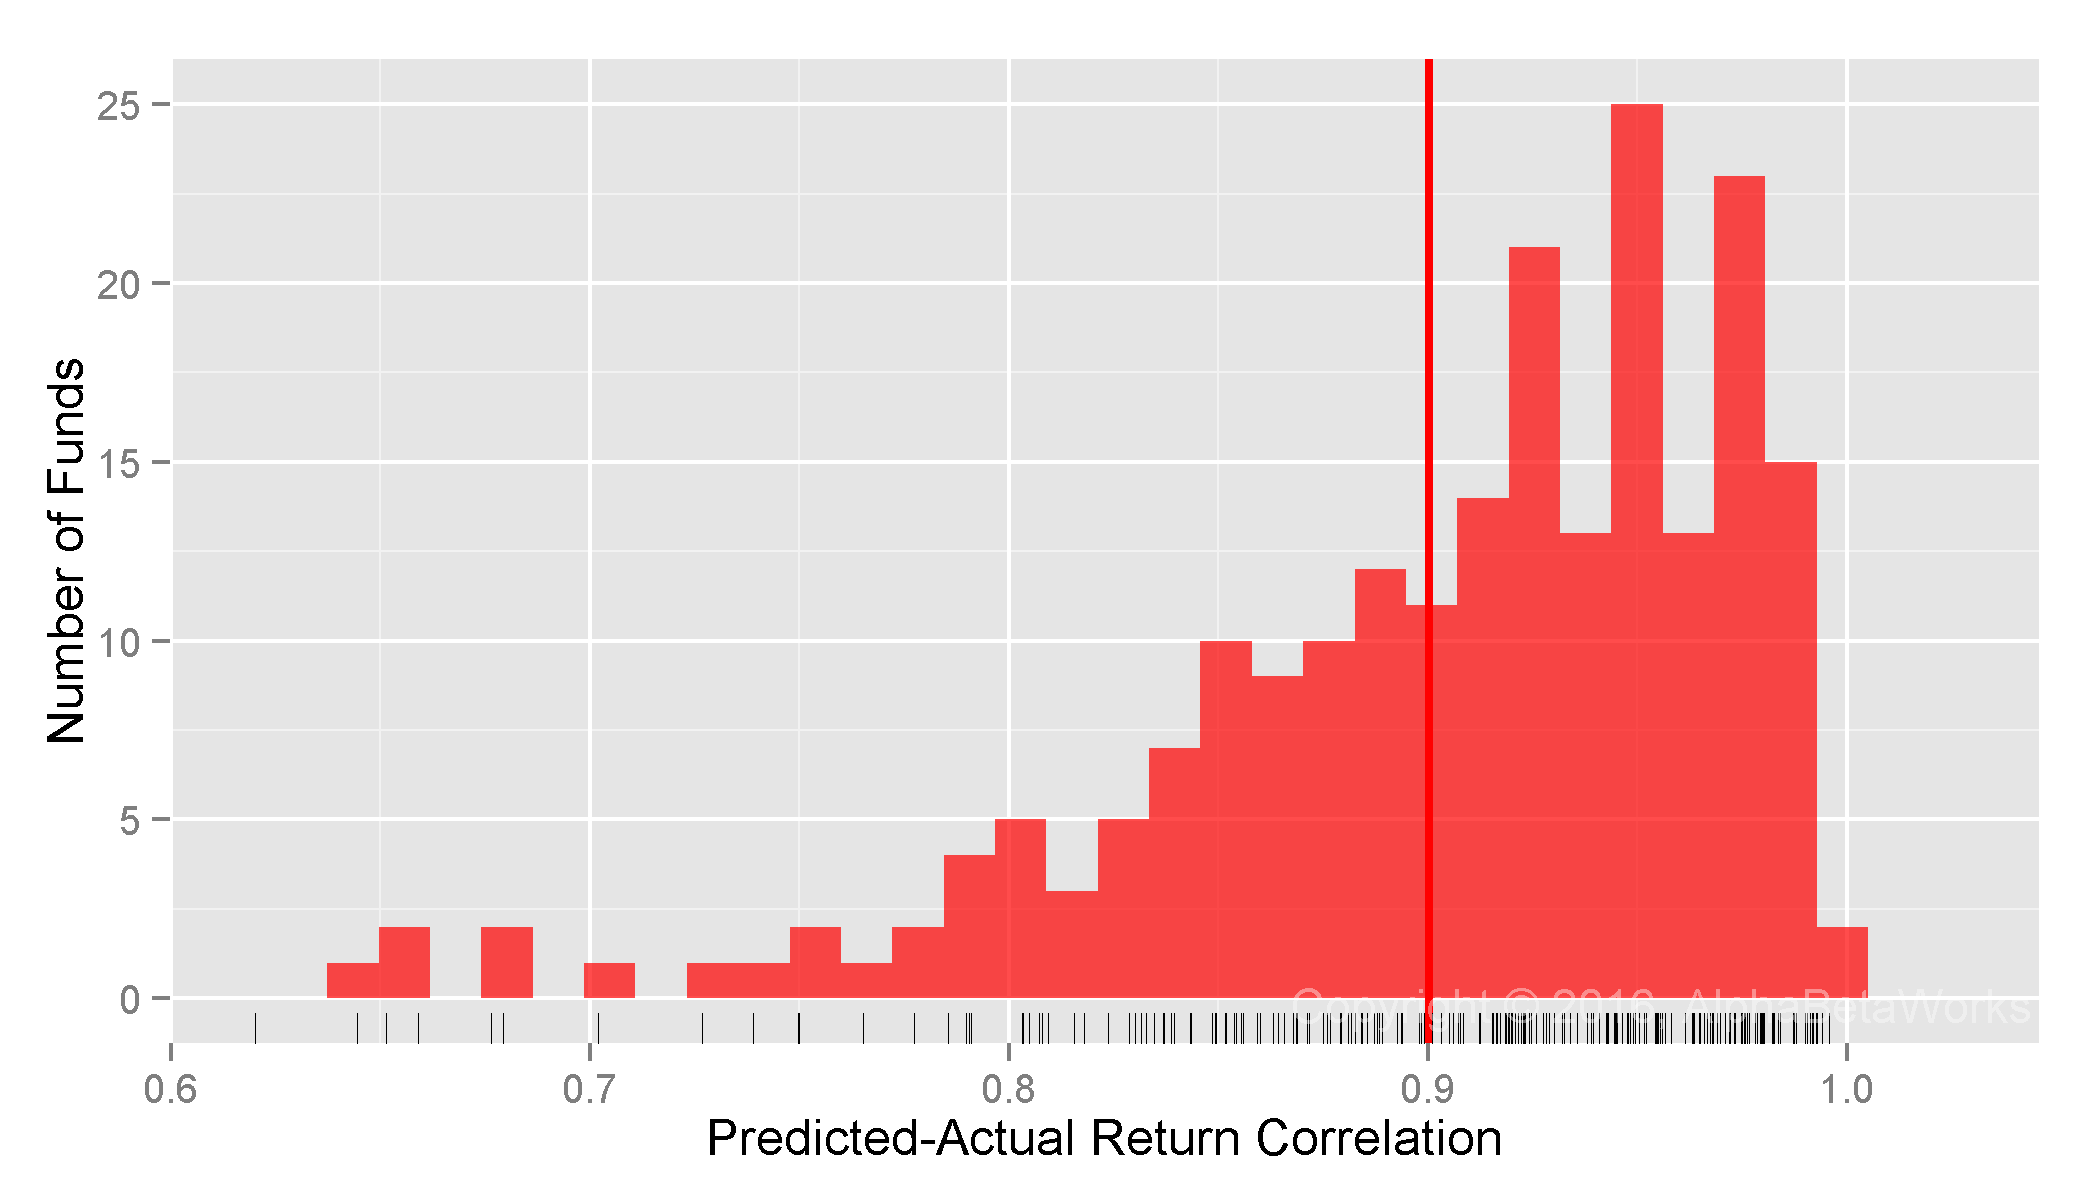
U.S. Hedge Fund Long Equity Portfolios: Correlation between a multi-factor statistical equity risk model’s predictions and actual monthly returns
  Min. 1st Qu.  Median    Mean 3rd Qu.    Max.
0.5055  0.8646  0.9204  0.9003  0.9554  0.9957
For the 25% of hedge fund portfolios it handles the worst, the model still achieves 0.51-0.86 correlation between predicted monthly returns and realized monthly returns.
Many of the outliers with low correlations hold substantial fixed income, exotic, and hybrid positions. To provide the most conservative assessment of the model’s predictive accuracy and the proportion of systematic risk, we did not alter the universe to exclude these outliers.
Unsurprisingly, given hedge funds’ aggressiveness, the model is less predictive for hedge funds than they are for mutual funds and insurance companies. Still, 85% of monthly return variance of most hedge fund long equity portfolios is systematic. And over 80% of that is due to a single factor. In other words, investors could replicate over 80% of this variance simply by replicating the hedge funds’ Market exposure.
Amazingly, much of the popular analysis of hedge fund risk and crowding ignores systemic factors and focuses solely on individual positions. This simplistic approach, even in the rare cases where it is done correctly, addresses only 15% of the risk that is residual, idiosyncratic, or stock-specific. Investors who rely on these simplistic approaches will make a variety of mistakes. For instance, they might wrongly conclude that two funds are differentiated because they have no positions in common. Yet, these two funds can have similar systematic factor exposures and thus high correlation; market hiccups will be magnified.
Conclusions
- For most U.S. hedge fund long equity portfolios estimated from regulatory filings, a robust statistical equity risk model delivers over 0.92 correlation between predicted monthly returns and realized monthly returns.
- 85% of the monthly return variance of hedge fund long equity portfolios is systematic, hence not attributable to individual stock bets.
- Fixation on hedge funds’ stock-specific bets and crowding is misguided and dangerous, since this risk accounts for at most 15% of the portfolio variance for most hedge funds.
- Investors who rely on simplistic approaches to hedge fund risk analysis may make a variety of mistakes, including missed crowding due to shared systematic factor exposures.


