
Equity risk models can be complex and hard to interpret. Moreover, differences in financial reporting and transparency across markets and companies can lead to inaccurate prediction for common fundamental models. Yet, when properly constructed, statistical equity risk models that capture the most salient factors built on robust statistics are highly predictive. This is especially true for US Property and Casualty (P&C) Insurance company portfolios:
- Even a simple single-factor model delivers over 0.96 median correlation between predicted and actual monthly returns for U.S. P&C equity portfolios;
- Sophisticated models that incorporate industry, macroeconomic, and style factors deliver over 0.97 median correlation between predicted and actual monthly returns for U.S. P&C equity portfolios.
- The difference in predictive accuracy between a perfect model and robust statistical models cited here is at most 0.03 higher median correlation and 5% higher explained share of variance.
Property and Casualty Insurance Equity Portfolio Sample
This analysis of P&C equity portfolios resulted from collaboration with Peer Analytics, the only provider of accurate peer universe comparisons to the insurance industry. We examined historical positions, factor exposures, and returns of approximately 500 U.S. P&C Insurance equity portfolios over the past 10 years.
Quantifying Predictive Power of Equity Risk Models
We follow the approach of our earlier studies of risk model accuracy. To evaluate the predictive accuracy of an equity risk model, we compare returns predicted by past factor exposures to the subsequent portfolio performance: We calculate factor exposures using estimated holdings at the end of each month and predict the following month’s returns using these ex-ante factor exposures and ex-post factor returns.
The correlation between predicted and actual returns measures a model’s accuracy. The higher the correlation, the more effective a model is at hedging, stress testing and scenario analysis, as well as evaluating investment skill.
Testing Predictions of Single-Factor Statistical Equity Risk Models
The simplest statistical equity risk model uses a single systematic risk factor – Market Beta. Since Market Beta is the dominant risk factor, even a simple model built with robust methods delivers 0.93 mean and 0.96 median correlations between predicted and actual monthly returns:
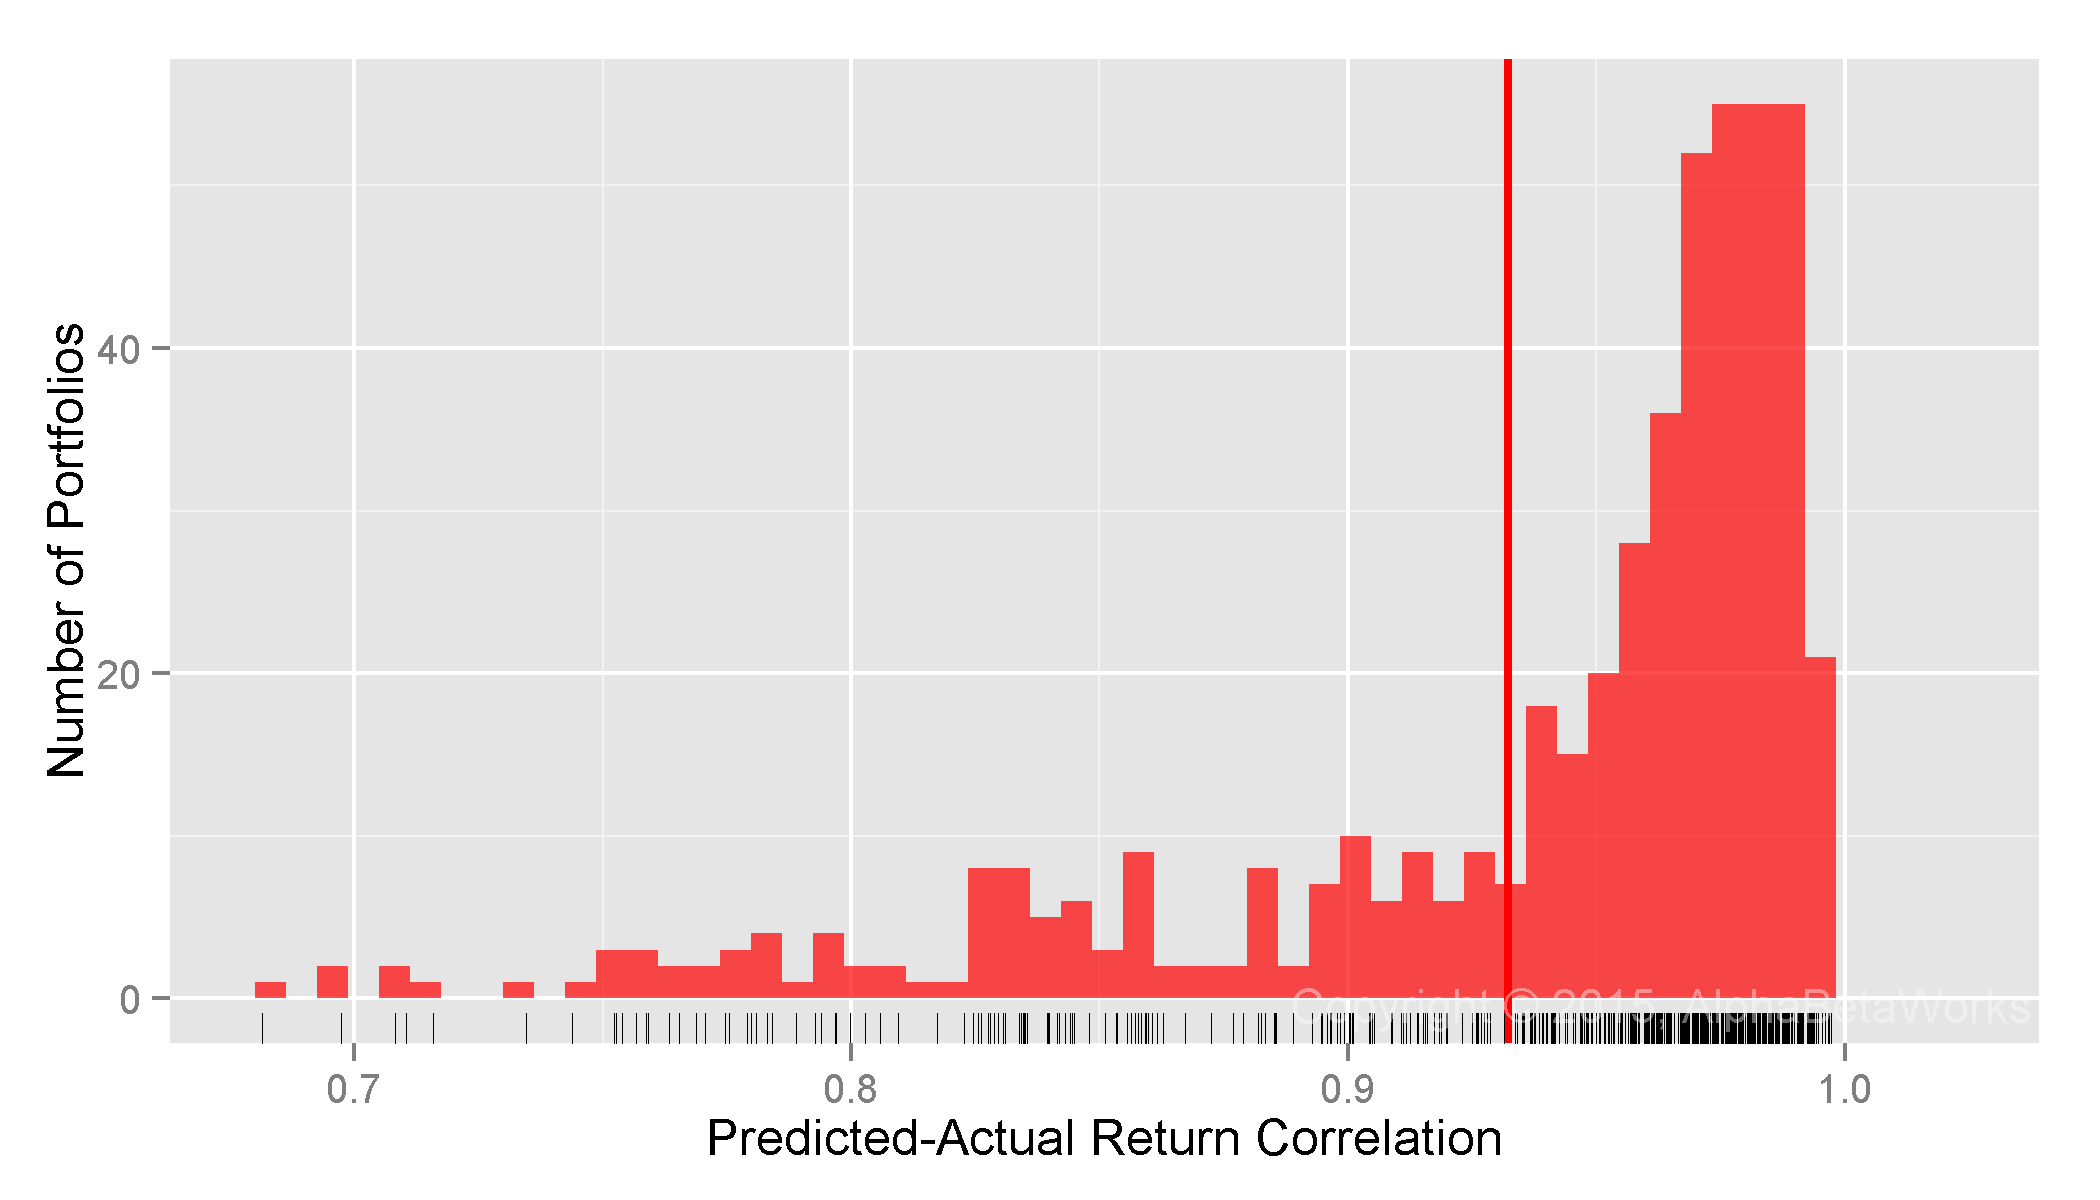
U.S. Property and Casualty Insurance Equity Portfolios: Correlation between a single-factor statistical equity risk model’s predictions and actual monthly returns
  Min. 1st Qu.  Median    Mean 3rd Qu.    Max.
0.4244  0.9146  0.9646  0.9322  0.9804  0.9973
Testing Predictions of Two-Factor Statistical Equity Risk Models
A two-factor model that adds a Sector Risk Factor, estimated with robust methods, delivers 0.95 mean and 0.97 median correlations between predicted and actual monthly returns:
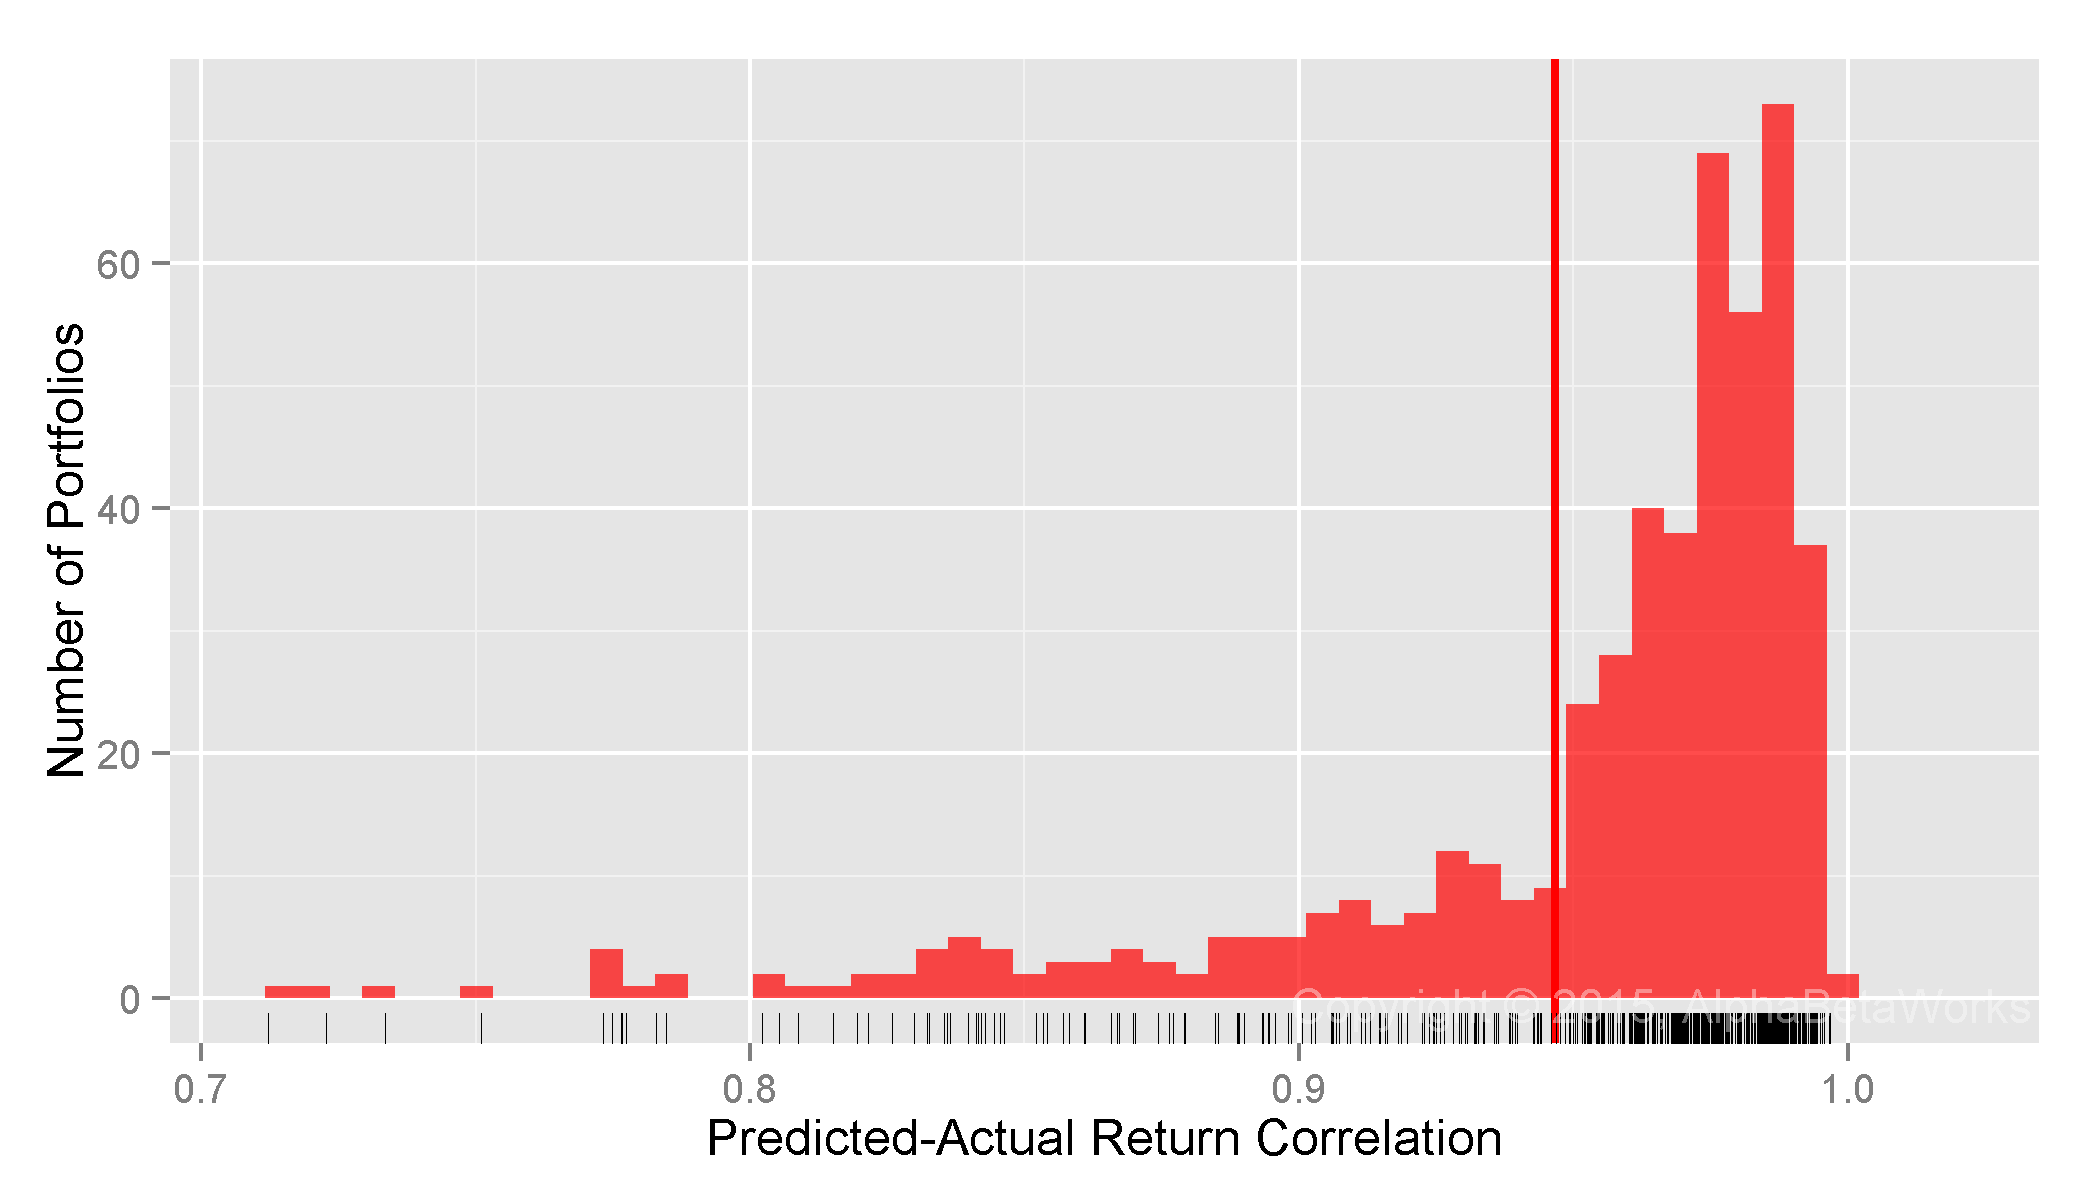
U.S. Property and Casualty Insurance Equity Portfolios: Correlation between a two-factor statistical equity risk model’s predictions and actual monthly returns
  Min. 1st Qu.  Median    Mean 3rd Qu.    Max.
0.4524  0.9396  0.9700  0.9466  0.9829  0.9969
Testing Predictions of Multi-Factor Statistical Equity Risk Models
With correlation between predicted and actual returns very close to 1, the benefit of additional factors is low. A perfect model would, at most, provide 0.03 higher correlation, and explain 0.0591 higher fraction of ex-post variance. In short, the benefit of highly complex models is limited and may not be worth the effort, complexity, or expense.
The AlphaBetaWorks U.S. Equity Statistical Risk Model extends the two-factor model with Style Factors (Value/Growth and Size) and Macroeconomic Factors (Bonds, Oil, Currency, etc.). It delivers 0.95 mean and 0.97 median correlations between predicted and actual monthly returns for U.S. Property and Casualty Insurance equity portfolios:
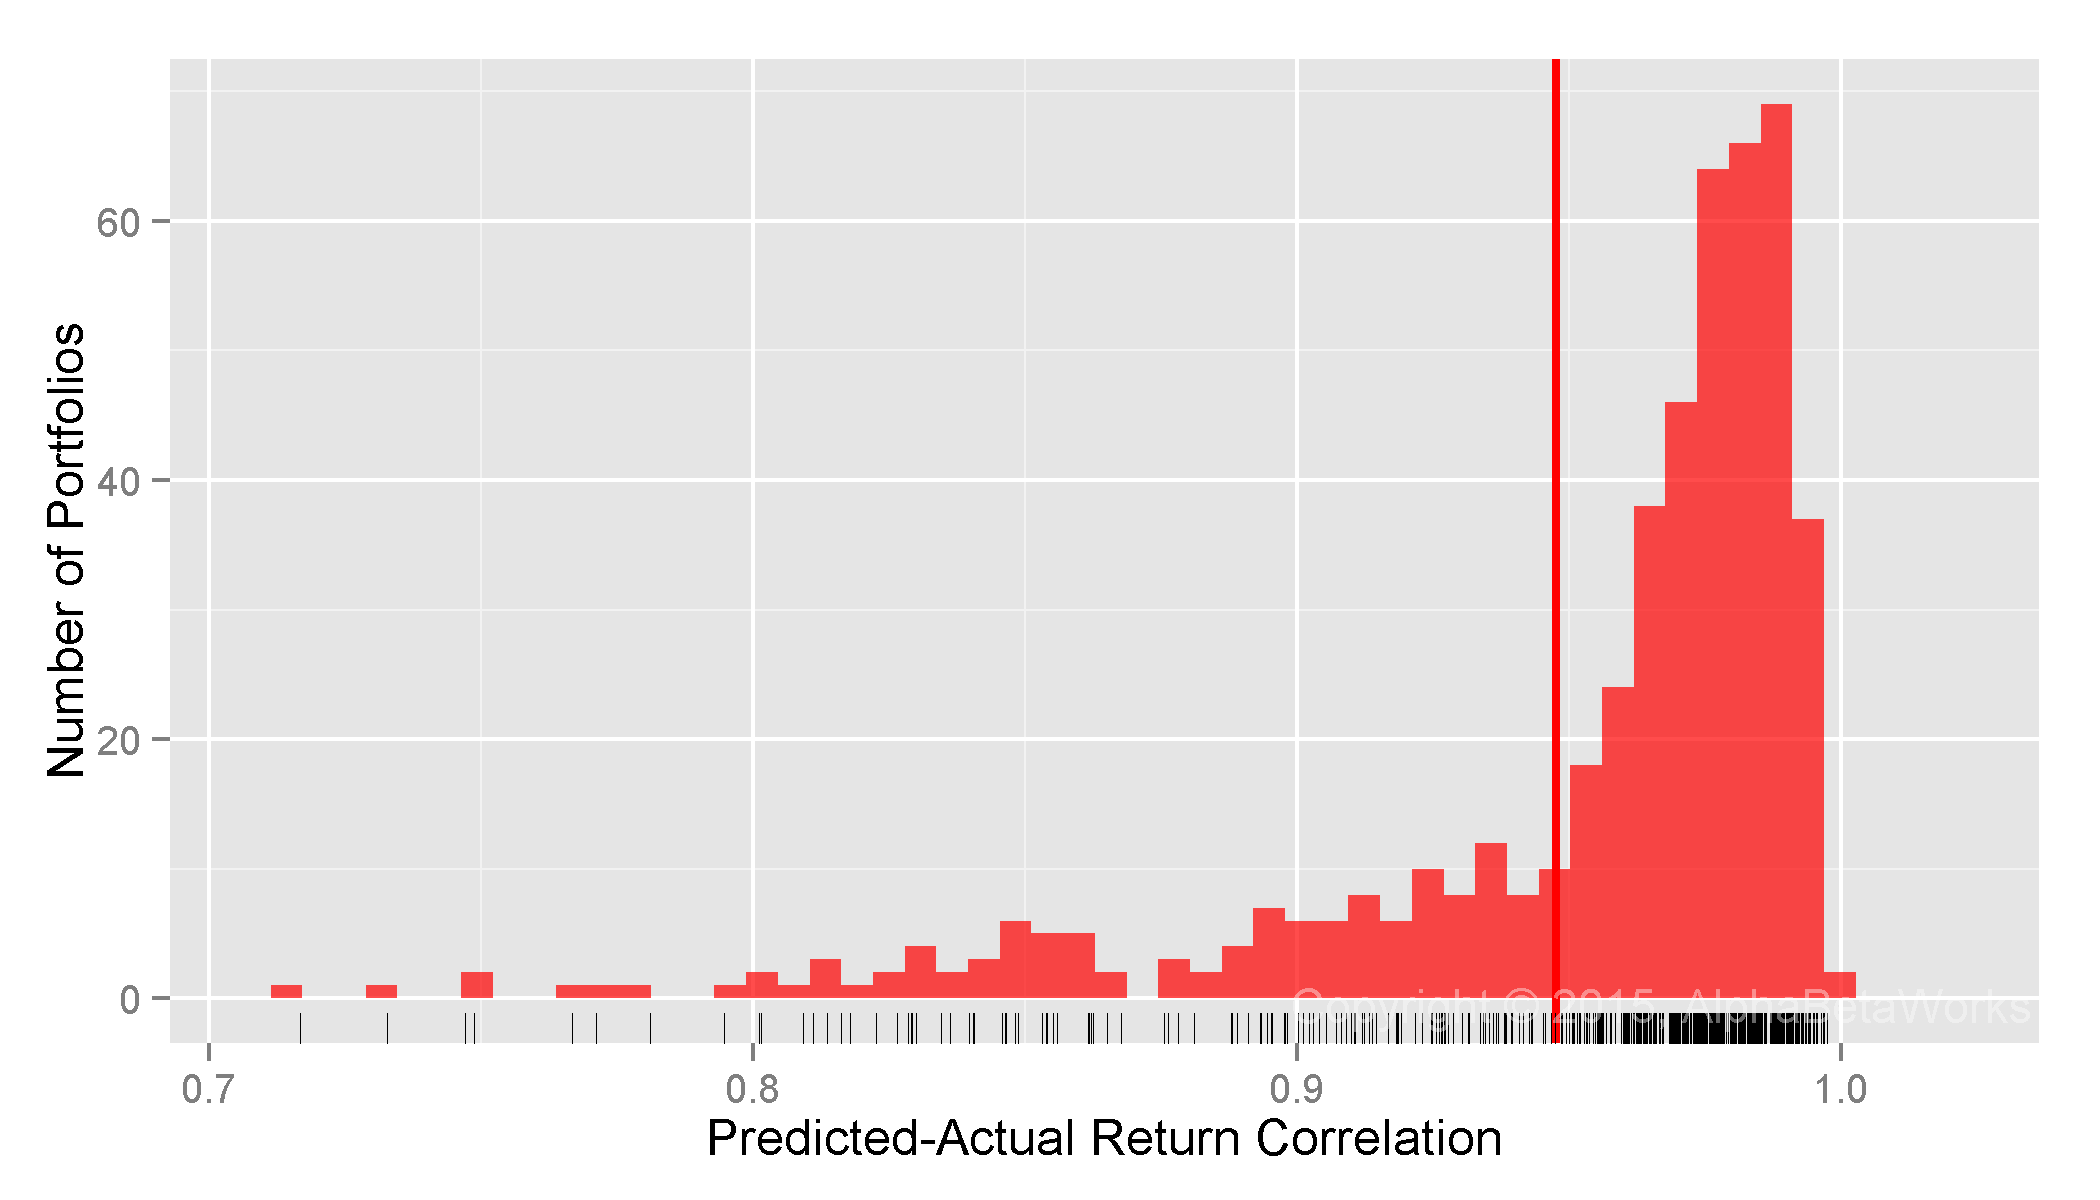
U.S. Property and Casualty Insurance Equity Portfolios: Correlation between a multi-factor statistical equity risk model’s predictions and actual monthly returns
  Min. 1st Qu.  Median    Mean 3rd Qu.    Max.
0.4622  0.9403  0.9723  0.9476  0.9839  0.9975
For the 25% P&C portfolios it handles the worst, the model still achieves 0.46-0.94 correlation between predicted and actual returns.
The sample contains outliers holding substantial bond fund positions, exotic investments, and concentrated stakes. These likely under-state models’ accuracy for a typical P&C equity portfolio – we did not alter the universe to provide the broadest possible sample and the most conservative assessment of predictive accuracy.
Summary
- Complex equity risk models may offer no better predictions than robust statistical models with a few intuitive factors.
- For a typical U.S. Property and Casualty Insurance equity portfolio, a robust statistical equity risk model delivers over 0.97 correlation between predicted and actual monthly returns.
- Even a perfect equity risk model would, at most, yield 0.03 higher correlation and explain 5.1% more ex-post variance.


