Category Archives: Smart Beta

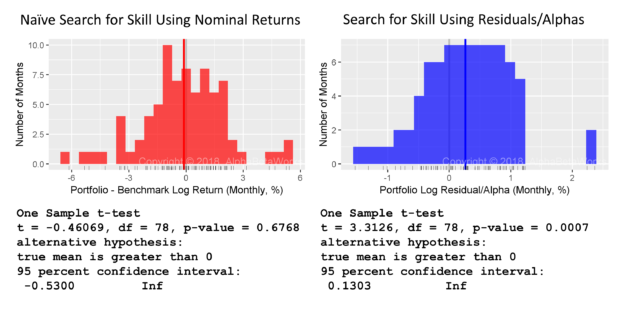
Chart of the distributions of Portfolio’s nominal returns and residual returns used to detect evidence of investment skill as well as the test statistics

How Much Time is Needed to Detect Evidence of Investment Skill?

A recent MarketWatch piece cited a talk in Hong Kong by Economics Nobel Prize winner Professor Robert Merton wherein he discussed the challenges of evaluating investment managers. The following article assumes that the above summary of Professor Merton’s talk is accurate. The piece, and assumedly the talk, argued that, given typical nominal portfolio returns and volatilities, it takes impractically long to detect evidence of investment skill. The argument claimed to prove that all manager selection is futile. Instead, it proved that naïve nominal performance metrics are of little use.

Any test of the effectiveness of manager selection is also a test of the analytical process that distills skill. That nominal investment performance is primarily due to factor (systematic, market) noise and thus reverts is well-known. It is thus unsurprising to find flaws in an approach to manager selection that is as antiquated as Ptolemaic Astronomy.

In this article, we will illustrate the difference between a naïve attempt to detect evidence of investment skill using nominal returns and a more productive effort relying on alphas (residual, security selection, stock picking returns) isolated using a capable modern multi-factor equity risk model. Whereas the former approach is futile at best, the latter approach is successful. In fact, rather than taking decades, a capable modern system can identify skill with high confidence in months.

Detecting Evidence of Investment Skill Using Nominal Returns

Consider nominal returns of a Portfolio and a Benchmark. The Portfolio is a live long-only fund implementing a Smart Beta active investment strategy:

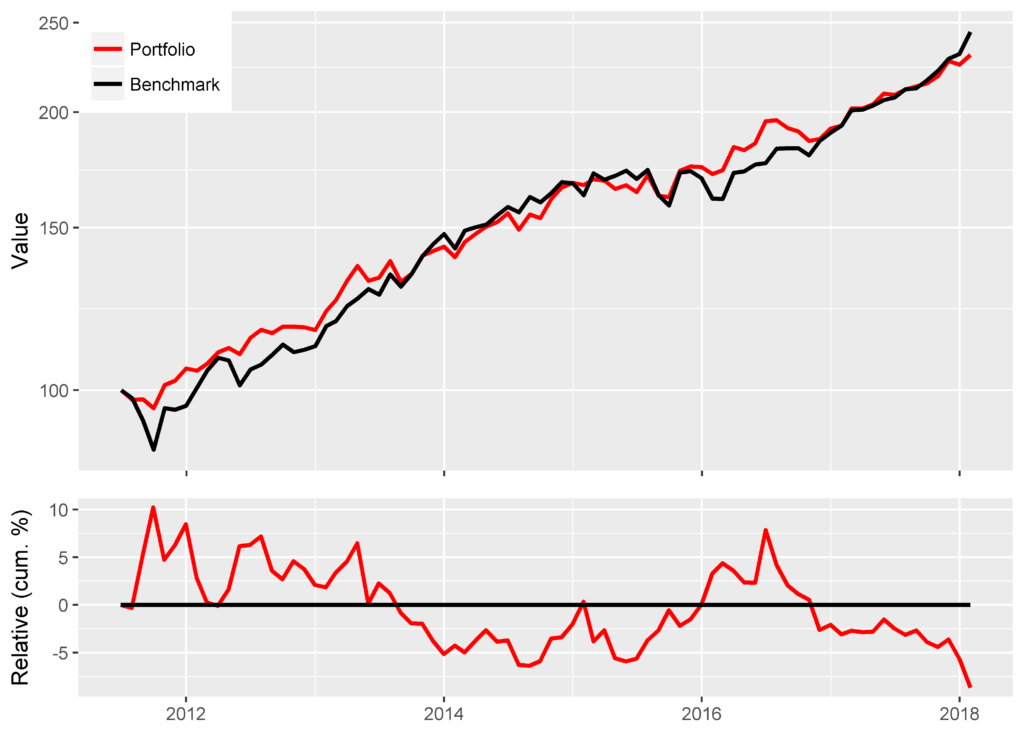
Chart of the absolute cumulative returns for the Portfolio and the Benchmark as well as Portfolio’s cumulative return relative to the Benchmark

Portfolio’s and Benchmark’s Cumulative Returns

                           Portfolio Benchmark
 Annualized Return            0.1336    0.1433
 Annualized Std Dev           0.0879    0.1093
 Annualized Sharpe (Rf=0%)    1.5194    1.3115

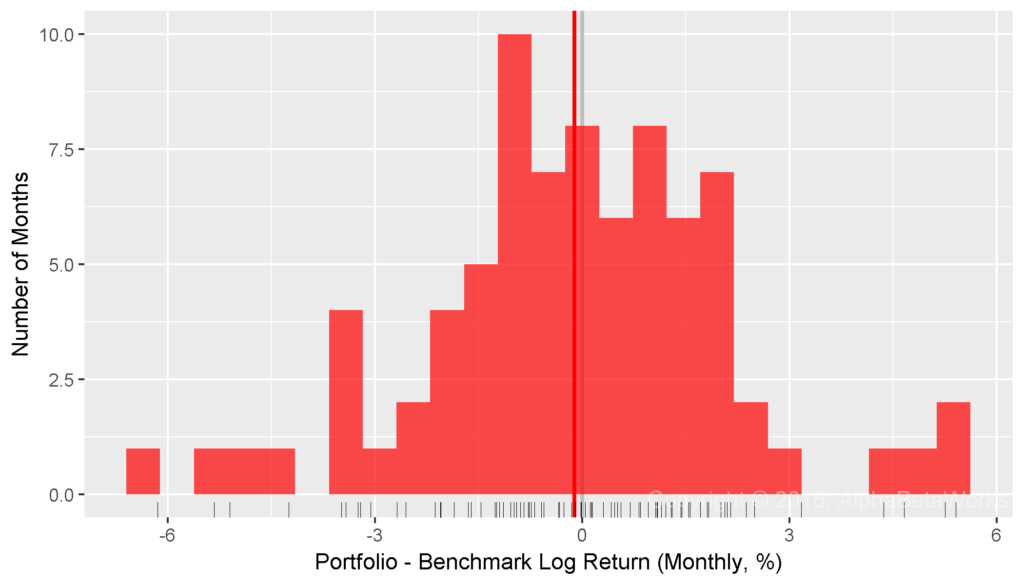
With a heroic assumption that log returns follow a normal distribution, a t-test appears to confirm Professor Merton’s argument. Even with over six years of data, the returns are too noisy for a statistical inference:

Chart of the distribution of Portfolio’s returns relative to the Benchmark used to detect evidence of investment skill

Distribution of Portfolio’s Returns Relative to the Benchmark

    Min. 1st Qu.  Median    Mean 3rd Qu.    Max. 
 -6.1441 -1.2186 -0.0201 -0.1149  1.2481  5.4068 
 
      One Sample t-test
 t = -0.4607, df = 78, p-value = 0.6768
 alternative hypothesis: true mean is greater than 0
 95 percent confidence interval:
  -0.5300        Inf

Detecting Evidence of Investment Skill Using Alphas/Residuals

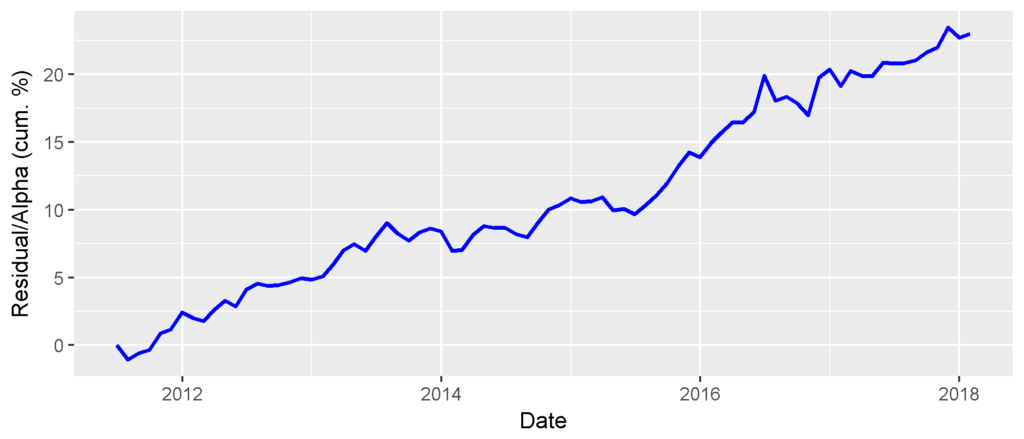
By comparison, consider the same Portfolio’s residual returns, or alphas, for the same period, isolated with the AlphaBetaWorks’ standard Long-Horizon Statistical U.S. Equity Risk Model. These are also the returns Portfolio would have generated if its factor exposures had been fully hedged (its returns factor-neutralized, or residualized) using the Model:

Chart of the absolute cumulative residual (alpha, security selection, stock picking returns) for the Portfolio

Portfolio’s Cumulative Residual/Alpha

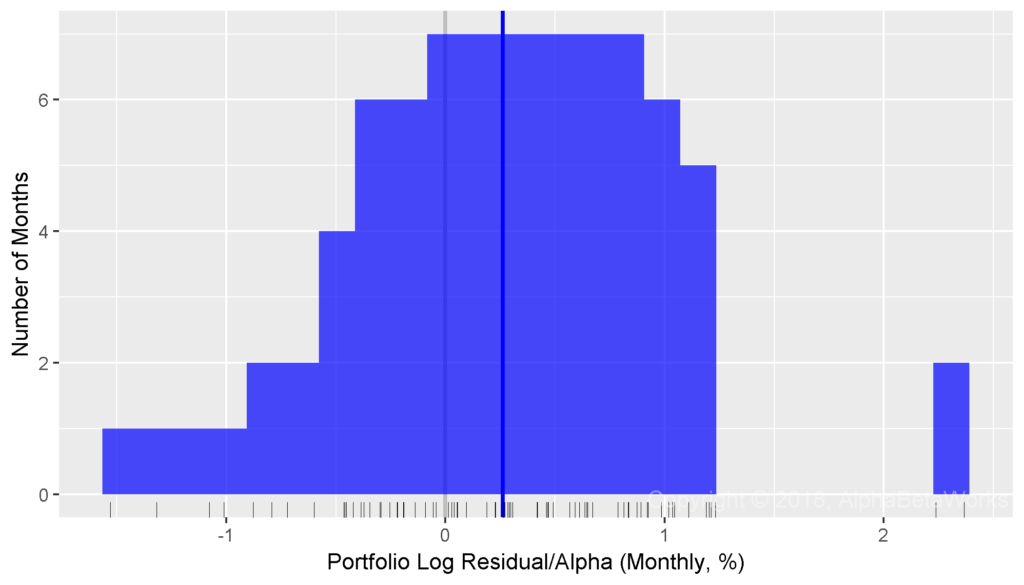
With an equally questionable assumption that log residuals follow a normal distribution, a t-test is now highly statistically significant:

Chart of the distribution of Portfolio’s residual returns used to detect evidence of investment skill

Distribution of the Portfolio’s Residuals/Alphas 

    Min. 1st Qu.  Median    Mean 3rd Qu.    Max. 
 -1.5300 -0.2064  0.2643  0.2620  0.7289  2.3663 
 
      One Sample t-test
 t = 3.3126, df = 78, p-value = 0.0007
 alternative hypothesis: true mean is greater than 0
 95 percent confidence interval:
  0.1303         Inf

Whereas Professor Merton’s argument does indeed apply to nominal returns, it does not apply to their residuals. A critical difference is the lower dispersion of residual returns. Over 90% of the variance of a typical active equity portfolio is due to factor exposures rather than to stock picking. Therefore, using nominal returns to measure skill is like trying to take a baby’s temperature by examining her bath water, rather than the baby herself.

Whereas at least 67 out of 100 monkeys picking stocks at random are expected to outperform the Portfolio, less than 1 out of 1,000 is expected to generate higher residuals – a highly statistically significant result. Thus, with the help of a capable equity risk model, strong evidence of skill can be identified in months rather than in decades.

Converting Residuals into Nominal Outperformance

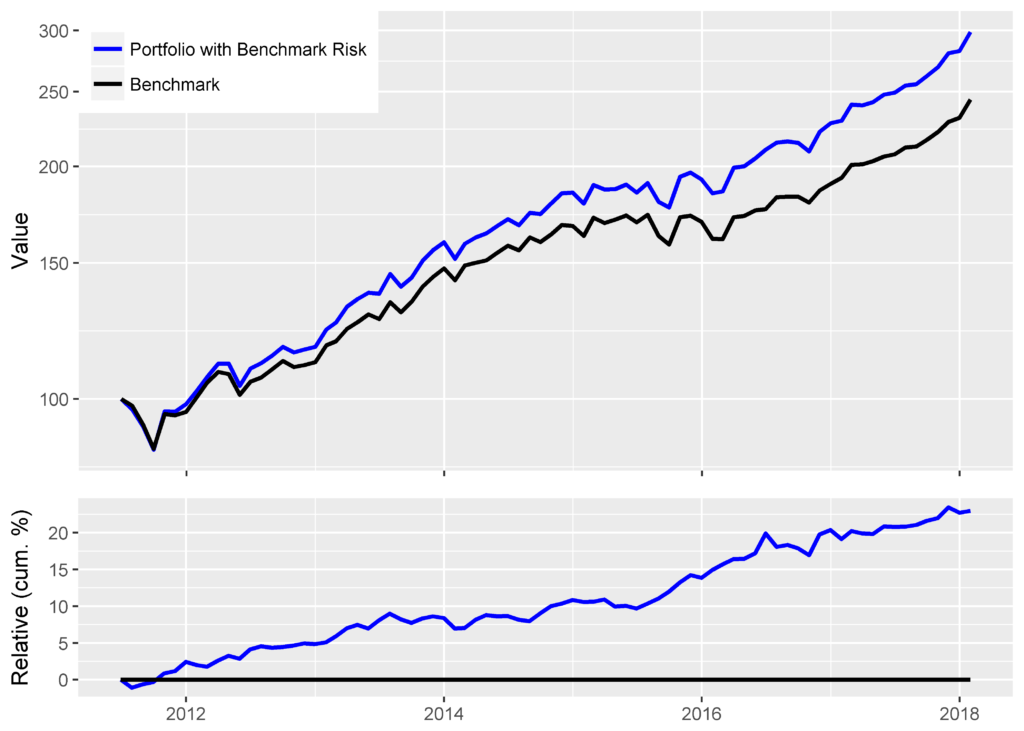
Assuming the equity risk model uses investable factors, as AlphaBetaWorks’s models do, the residual return stream above is investable. In fact, in the idealized case of costless leverage, positive residual returns can be turned into outperformance relative to any benchmark. Below is the performance of Portfolio after it is hedged to match the factor exposures of the Benchmark. The evidence of skill is now plainly visible in the naïve absolute and relative nominal return metrics:

Chart of the absolute cumulative returns for the Portfolio hedged to match the factor exposures of the Benchmark, the Benchmark, as well as Portfolio’s cumulative return relative to the Benchmark

Cumulative Returns for the Portfolio Hedged to Match the Benchmark and the Benchmark

                          Portfolio with Benchmark Risk  Benchmark
 Annualized Return                                0.1784    0.1433
 Annualized Std Dev                               0.1168    0.1093
 Annualized Sharpe (Rf=0%)                        1.5276    1.3115

Conclusions

  • Since factor noise dominates nominal returns, the use of nominal returns to detect evidence of investment skill takes far too long to be practical.
  • After distilling stock picking performance (alphas, residual returns) from factor noise, statistically significant evidence of investment skill can become evident in months, rather than in decades.
  • Hedging makes it possible to turn positive stock picking returns into nominal outperformance with respect to any benchmark.
The information herein is not represented or warranted to be accurate, correct, complete or timely.
Past performance is no guarantee of future results.
Copyright © 2012-2018, AlphaBetaWorks, a division of Alpha Beta Analytics, LLC. All rights reserved.
Content may not be republished without express written consent.

What Fraction of International Smart Beta Tracking Error is Dumb Beta?

In earlier articles, we showed that the returns of most U.S. and international smart beta ETFs are primarily due to their dumb beta (dumb factor) exposures. Thus, smart beta ETFs turn out to actively time dumb beta factors. In fact, most smart beta strategies are primarily different approaches to sector rotation. After readers’ requests to extend the above analysis to relative returns and tracking error, we showed that the findings hold for U.S. smart beta tracking error. This article extends the analysis to international smart beta tracking error.

The results hold for international smart beta tracking error: Though some international smart beta ETFs do provide valuable exposures to idiosyncratic factors, most primarily re-shuffle basic dumb Region and Sector Factors.  In fact, dumb beta exposures are even more influential for international smart beta equity ETFs than for their U.S. peers. Most international smart beta equity ETFs are mainly region and sector rotation strategies in disguise. Consequently, investors and allocators must guard against fancy re-packaging of dumb international risk factors as smart beta and should perform rigorous region and sector factor analysis of their smart beta allocations. Further, many international smart beta strategies can be substantially replicated and blended using simple passive Region and Sector Factors.

Measuring the Influence of Dumb Beta Factors on International Smart Beta ETFs

We used the same dataset of International Smart Beta Equity ETFs as our earlier article on international smart beta ETFs’ dumb factor exposures. We estimated monthly positions of each ETF and then used these positions to calculate portfolio factor exposures to traditional factors such as Regions and Sectors.  These ex-ante factor exposures at the end of month m1 were used to predict returns during the subsequent month m2. We then calculated predicted and actual returns relative to the Global Equity Market (defined as the iShares MSCI ACWI Index Fund – ACWI). The correlation between actual and predicted relative returns quantified the influence of dumb beta factors on smart beta tracking error. The higher the correlation, the more similar a smart beta ETF is to a portfolio of traditional, simple, and dumb systematic risk factors.

The Influence of Region Beta on International Smart Beta ETFs

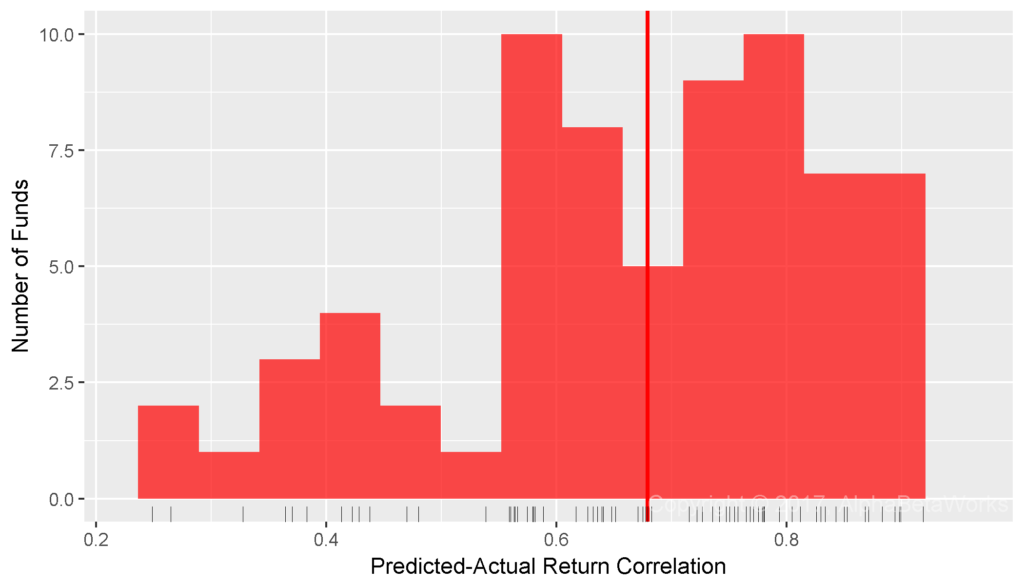
The simplest systematic risk factor to describe each security is its Region (Region Market Beta). Region Beta measures exposure to one of 10 broad regional equity markets (e.g., North America, Developing Asia). These are the most basic and cheap passive international factors. Even this single-factor model estimated with robust statistical techniques delivered 0.67 mean and 0.68 median correlations between predicted and actual relative returns:

Chart of the correlations between relative returns of replicating portfolios constructed using Region Factors and actual relative returns for international smart beta equity ETFs

International Smart Beta Equity ETFs: Correlation between relative returns predicted using Region Factors and actual relative returns

  Min. 1st Qu.  Median    Mean 3rd Qu.    Max. 
0.2490  0.5662  0.6791  0.6655  0.7805  0.9185

For a quarter of smart beta ETFs, Region Factor alone replicates 61% (0.7805²) of tracking error. For this group of strategies, international smart beta tracking error is largely due to region rotation.

The Influence of Region and Sector Betas on International Smart Beta ETFs

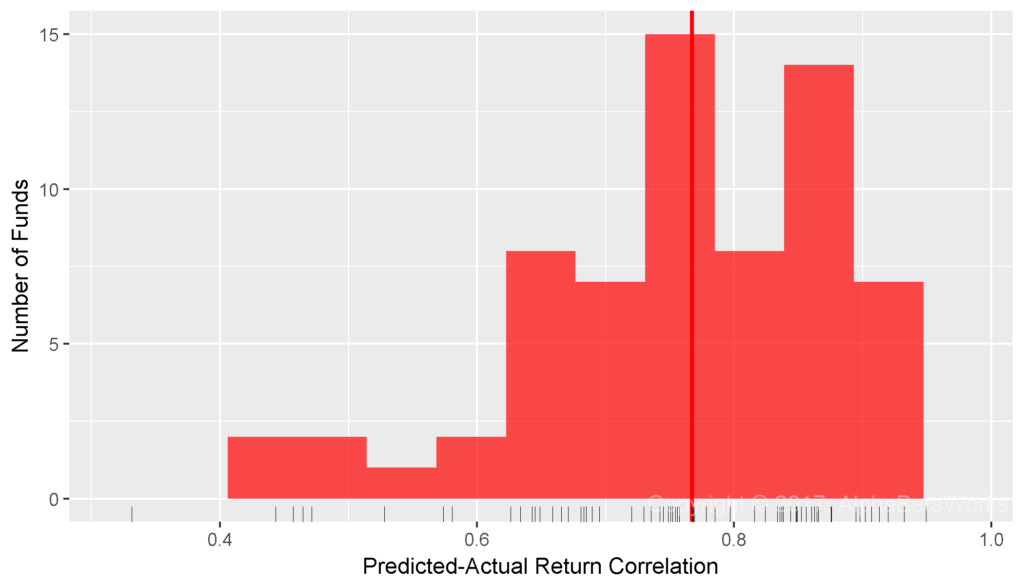
We next extended the model with Sector Factors. Sector Beta measures exposure to one of 10 broad sectors (e.g., Energy, Technology). Region and Sector Betas, estimated with robust methods, delivered 0.75 mean and 0.77 median correlations between predicted and actual relative returns:

Chart of the correlations between relative returns of replicating portfolios constructed using Region and Sector Factors and actual relative returns for international smart beta equity ETFs

International Smart Beta Equity ETFs: Correlation between relative returns predicted using Region and Sector Factors and actual relative returns

  Min. 1st Qu.  Median    Mean 3rd Qu.    Max. 
0.2604  0.6807  0.7673  0.7461  0.8523  0.9494

For most international smart beta ETFs, Region and Sector Factors replicate 59% (0.7673²) of tracking error. Thus, for most international smart beta equity ETFs, over half of tracking error is due to region and sector rotation.

International Smart Beta Variance and International Dumb Beta Variance

Rather than measure correlations between relative returns of replicating dumb beta portfolios and ETFs, we can instead measure the fractions of their (relative) variances unexplained by dumb beta exposures. The Dumb Beta Variance (in red below) is the distribution of ETFs’ relative variances due to their dumb Region and Sector Factor exposures. The Smart Beta Variance (in blue below) is the distribution of ETFs’ relative variances unrelated to their dumb beta exposures:

Chart of the percentage of international smart beta tracking error explained by traditional, non-smart, or dumb beta Region and Sector Factors and the percentage of tracking error unexplained by these factors for international smart beta equity ETFs

International Equity Smart Beta ETFs: Percentage of tracking error explained and unexplained by the Region and Sector dumb beta exposures

Percentage of international equity smart beta ETFs’ relative variances due to dumb beta exposures:

Min. 1st Qu.  Median    Mean 3rd Qu.    Max. 
6.78   46.34   58.88   57.70   72.65   90.13

Percentage of international equity smart beta ETFs’ relative variances unrelated to dumb beta exposures:

Min. 1st Qu.  Median    Mean 3rd Qu.    Max. 
9.87   27.35   41.12   42.30   53.66   93.22

For a quarter of strategies, over 2/3 of international smart beta tracking error is due to region and sector rotation, and for some, it reaches 90%.

Our analysis focused on the most basic Region and Sector Factors and excluded Value/Growth and Size Factors, which are decades old and also considered dumb beta by some. If one expands the list of dumb beta factors, smart beta variance shrinks further.

Conclusions

  • Traditional, or dumb, Region and Sector Betas account for the majority of international smart beta tracking error.
  • Smart beta effects, unexplained by the traditional Region and Sector Betas, account for 41% of variance or less for most international smart beta ETFs.
  • With proper analytics, investors and allocators can identify products that do provide unique international smart beta exposures and can guard against fancy re-packaging of dumb international beta.
  • Investors and allocators can monitor the majority of international smart beta ETF relative risk by focusing on their Region and Sector Factor exposures.
  • Most international smart beta strategies can be combined using Region and Sector Factor portfolios.
The information herein is not represented or warranted to be accurate, correct, complete or timely.
Past performance is no guarantee of future results.
Copyright © 2012-2017, AlphaBetaWorks, a division of Alpha Beta Analytics, LLC. All rights reserved.
Content may not be republished without express written consent.

What Fraction of Smart Beta Tracking Error is Dumb Beta?

Our earlier articles discussed how some smart beta strategies turn out to be merely high beta strategies and how others actively time the market. We also showed that, for the majority of smart beta ETFs, returns are mostly attributable to the traditional dumb Market and Sector Factors. Consequently, the absolute performance of most smart beta strategies can be substantially captured by sector rotation. We received questions about these studies’ focus on absolute performance: The attribution of absolute performance to the Market and Sector factors tells little about tracking error and relative variance. Perhaps smart beta volatility is attributable to dumb factors, but smart beta tracking error is not?

This article addresses the above criticism and analyzes smart beta tracking error rather than (absolute) volatility. The results hold: Though some smart beta ETFs do provide valuable exposures to idiosyncratic factors, most primarily re-shuffle basic dumb factors. Whether one considers their absolute or relative performance, most smart beta equity ETFs are largely sector rotation strategies in disguise. Consequently, investors and allocators must guard against elaborate re-packaging of dumb factors as smart beta and perform rigorous sector and industry analysis of their smart beta allocations. Further, dozens of smart beta strategies can be substantially replicated and blended using simple sector factor portfolios.

Measuring the Influence of Dumb Beta Factors on Smart Beta ETFs

We used the same U.S. Smart Beta ETF dataset as our earlier study of smart beta ETFs’ dumb factor exposures. For each ETF, we estimated monthly positions and then used these positions to calculate portfolio factor exposures for traditional (dumb beta) factors such as Market and Sectors.  The ex-ante factor exposures at the end of each month were used to predict the following month’s returns. The correlation between actual and predicted returns relative to the U.S. Equity Market (defined as the iShares Russell 3000 ETF – IWV) quantified the influence of dumb beta factors on smart beta tracking error. The higher the correlation, the more similar a smart beta ETF is to a portfolio of traditional, simple, and dumb systematic risk factors.

The Influence of Market Beta on Smart Beta ETFs

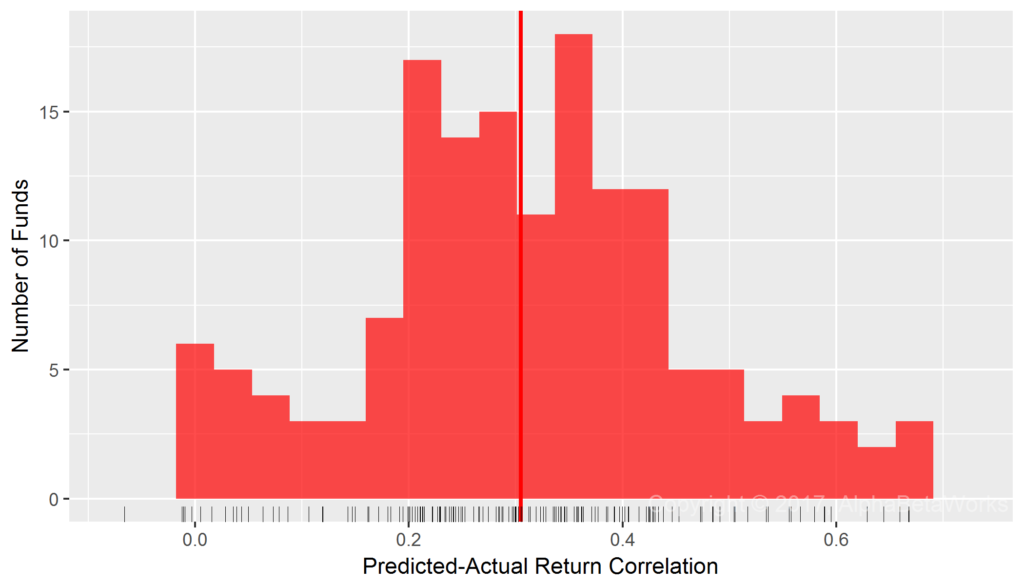
Our simplest test used a single systematic risk factor – Market Beta. Median correlation between predicted and actual relative returns of smart beta ETFs was 0.31:

Chart of the correlations between predicted relative returns constructed using a single Market factor and actual relative historical returns for over 200 U.S. smart beta equity ETFs

U.S. Smart Beta Equity ETFs: Correlation between predicted relative returns and actual relative returns using a single Market factor

   Min. 1st Qu.  Median    Mean 3rd Qu.    Max. 
-0.1089  0.2129  0.3050  0.3096  0.4053  0.8899

The influence of Market Beta on tracking error is much lower than its influence on absolute variance since it only measures relative performance due to deviations from Market’s risk.

The Influence of Market and Sector Betas on Smart Beta ETFs

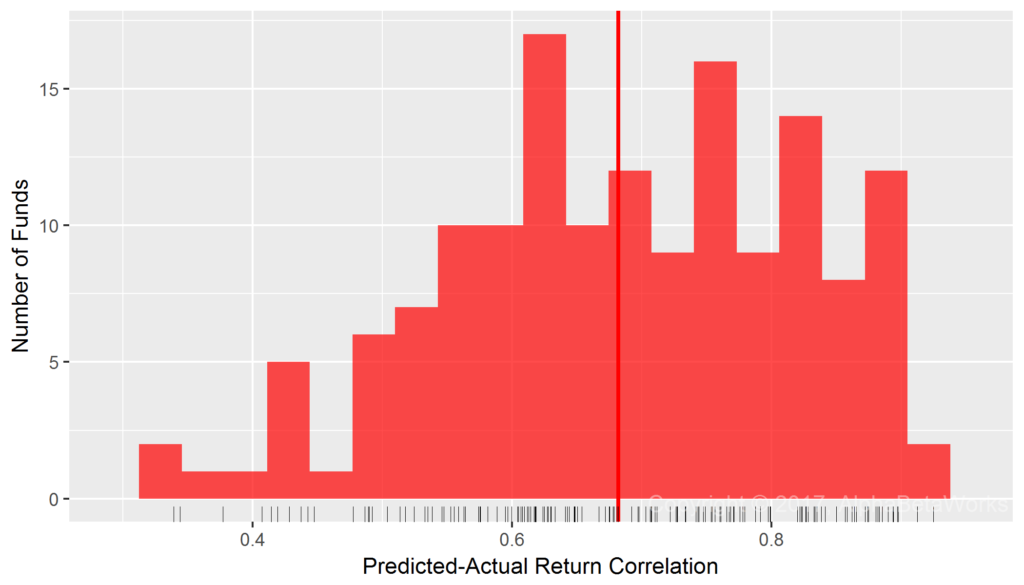
We next tested a two-factor model that added a Sector Factor. Each security belonged to one of 10 broad sectors (e.g., Energy, Technology). Market and Sector Betas, estimated with robust methods, delivered 0.68 mean and median correlations between predicted and actual relative returns of smart beta ETFs:

Chart of the correlations between predicted relative returns constructed using Market and Sector factors and actual historical returns for over 200 U.S. smart beta equity ETFs

U.S. Smart Beta Equity ETFs: Correlation between predicted relative returns and actual relative returns using Market and Sector factors

  Min. 1st Qu.  Median    Mean 3rd Qu.    Max. 
0.0355  0.5983  0.6821  0.6801  0.7981  0.9630

Put differently: For most broad U.S. equity smart beta ETFs, U.S. Market and Sector Betas alone account for approximately half of tracking error and relative variance.

The Influence of all Dumb Factor Betas on Smart Beta ETFs

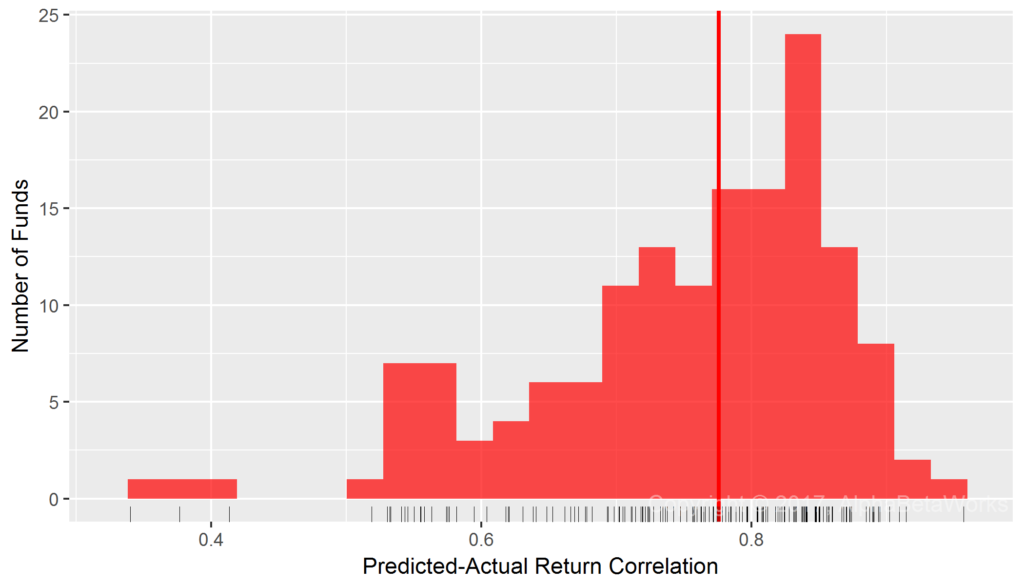
For the final tests, we added additional dumb factors such as Bonds, Value, and Size. All dumb factor betas delivered 0.74 mean and 0.78 median correlations between predicted and actual relative returns of smart beta ETFs:

Chart of the correlations between predicted relative returns constructed using dumb risk factors and actual historical returns for over 200 U.S. smart beta equity ETFs

U.S. Smart Beta Equity ETFs: Correlation between predicted relative returns and actual relative returns using dumb beta factors

  Min. 1st Qu.  Median    Mean 3rd Qu.    Max. 
0.2094  0.6875  0.7759  0.7447  0.8387  0.9715

Thus, for most broad U.S. equity smart beta ETFs, dumb beta factors account for the majority of tracking error.

Smart Beta Tracking Error and Dumb Beta Tracking Error

Rather than measure correlations between relative returns predicted by dumb beta exposures and actual relative returns, we can instead measure the fraction of relative variance unexplained by dumb beta exposures. This value (in blue below) is the fraction of smart beta tracking error that is unrelated to dumb beta factors:

Chart of the percentage of tracking error or variance explained by traditional, non-smart, or dumb beta factors and the percentage of tracking error unexplained by these factors for over 200 U.S. smart beta equity ETFs

Percentage of Smart Beta Tracking Error Explained and Unexplained by Dumb Beta Factors

Percentage of Tracking Error Explained by Dumb Beta Factors

 Min. 1st Qu.  Median    Mean 3rd Qu.    Max. 
4.384  47.268  60.197  57.141  70.346  94.381

Percentage of Tracking Error Unexplained by Dumb Beta Factors

 Min. 1st Qu.  Median    Mean 3rd Qu.    Max. 
5.619  29.654  39.803  42.859  52.732  95.616

Conclusions

  • Dumb factor exposures are responsible for over 60% of the smart beta tracking error for most strategies.
  • Market and Sector Factors alone account for half of the tracking error for most U.S. equity smart beta ETFs.
  • Most smart beta strategies can be viewed as (largely) various approaches to sector rotation. They can also be substantially replicated and blended using sector rotation.
The information herein is not represented or warranted to be accurate, correct, complete or timely.
Past performance is no guarantee of future results.
Copyright © 2012-2017, AlphaBetaWorks, a division of Alpha Beta Analytics, LLC. All rights reserved.
Content may not be republished without express written consent.