Our earlier piece tested several equity market hedging techniques on U.S. equity mutual fund portfolios. We now extend the tests to U.S. hedge fund long equity portfolios. Since these are generally less diversified and more active than mutual funds, simplistic approaches that use a fixed 100% short (1 beta) or rely on returns-based style analysis (RBSA) fail even more dramatically for hedge funds. Yet, a robust statistical equity risk model applied to portfolio holdings remains close to the ideal of perfect hedging. A robust and well-tested technique is thus even more vital for managing hedge fund exposures.
Equity Market Hedging Techniques
We analyze approximately 600 hedge fund long U.S. equity portfolios that are tractable from regulatory filings. Note that roughly half of U.S. hedge fund portfolios are impossible to analyze accurately due to the quarterly data frequency and high turnover. Similarly to our earlier analysis of mutual fund portfolio hedging, we evaluate three approaches to calculating market hedge ratios:
- Constant 100% market exposure (1 beta): This common ad-hoc approach used by portfolio managers and analytics vendors supposes that all portfolios have the same risk as a benchmark or a hedge.
- Returns-based style analysis (RBSA): This statistical approach estimates portfolio factor exposures by regressing portfolio returns against factor returns.
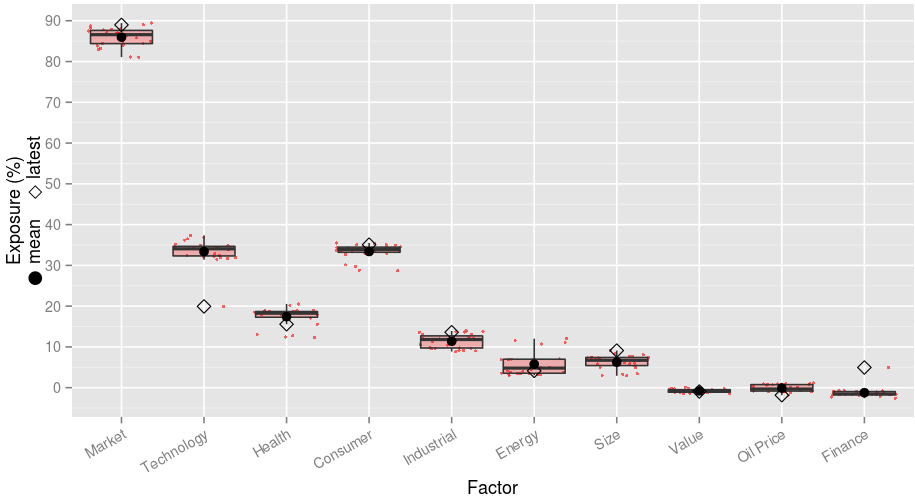
- Statistical equity risk model applied to portfolio holdings: A more statistically and algorithmically intensive technique estimates factor exposures of positions, essentially performing RBSA on individual stocks, and aggregates these to calculate portfolio factor exposures.
Our study spans 10 years. We calculate hedge ratios at the end of each month and use these to hedge portfolios during the following month. This produces a series of 10-year realized (ex-post) hedged portfolio returns. We further break these series into 12-month intervals and calculate their correlations to the Market. Low average market correlation and low dispersion of correlations indicates that a hedging technique effectively eliminates systematic market exposure of a typical portfolio.
Realized Market Correlations of Hedged Hedge Fund Portfolios
Realized Market Correlations of Random Return Series
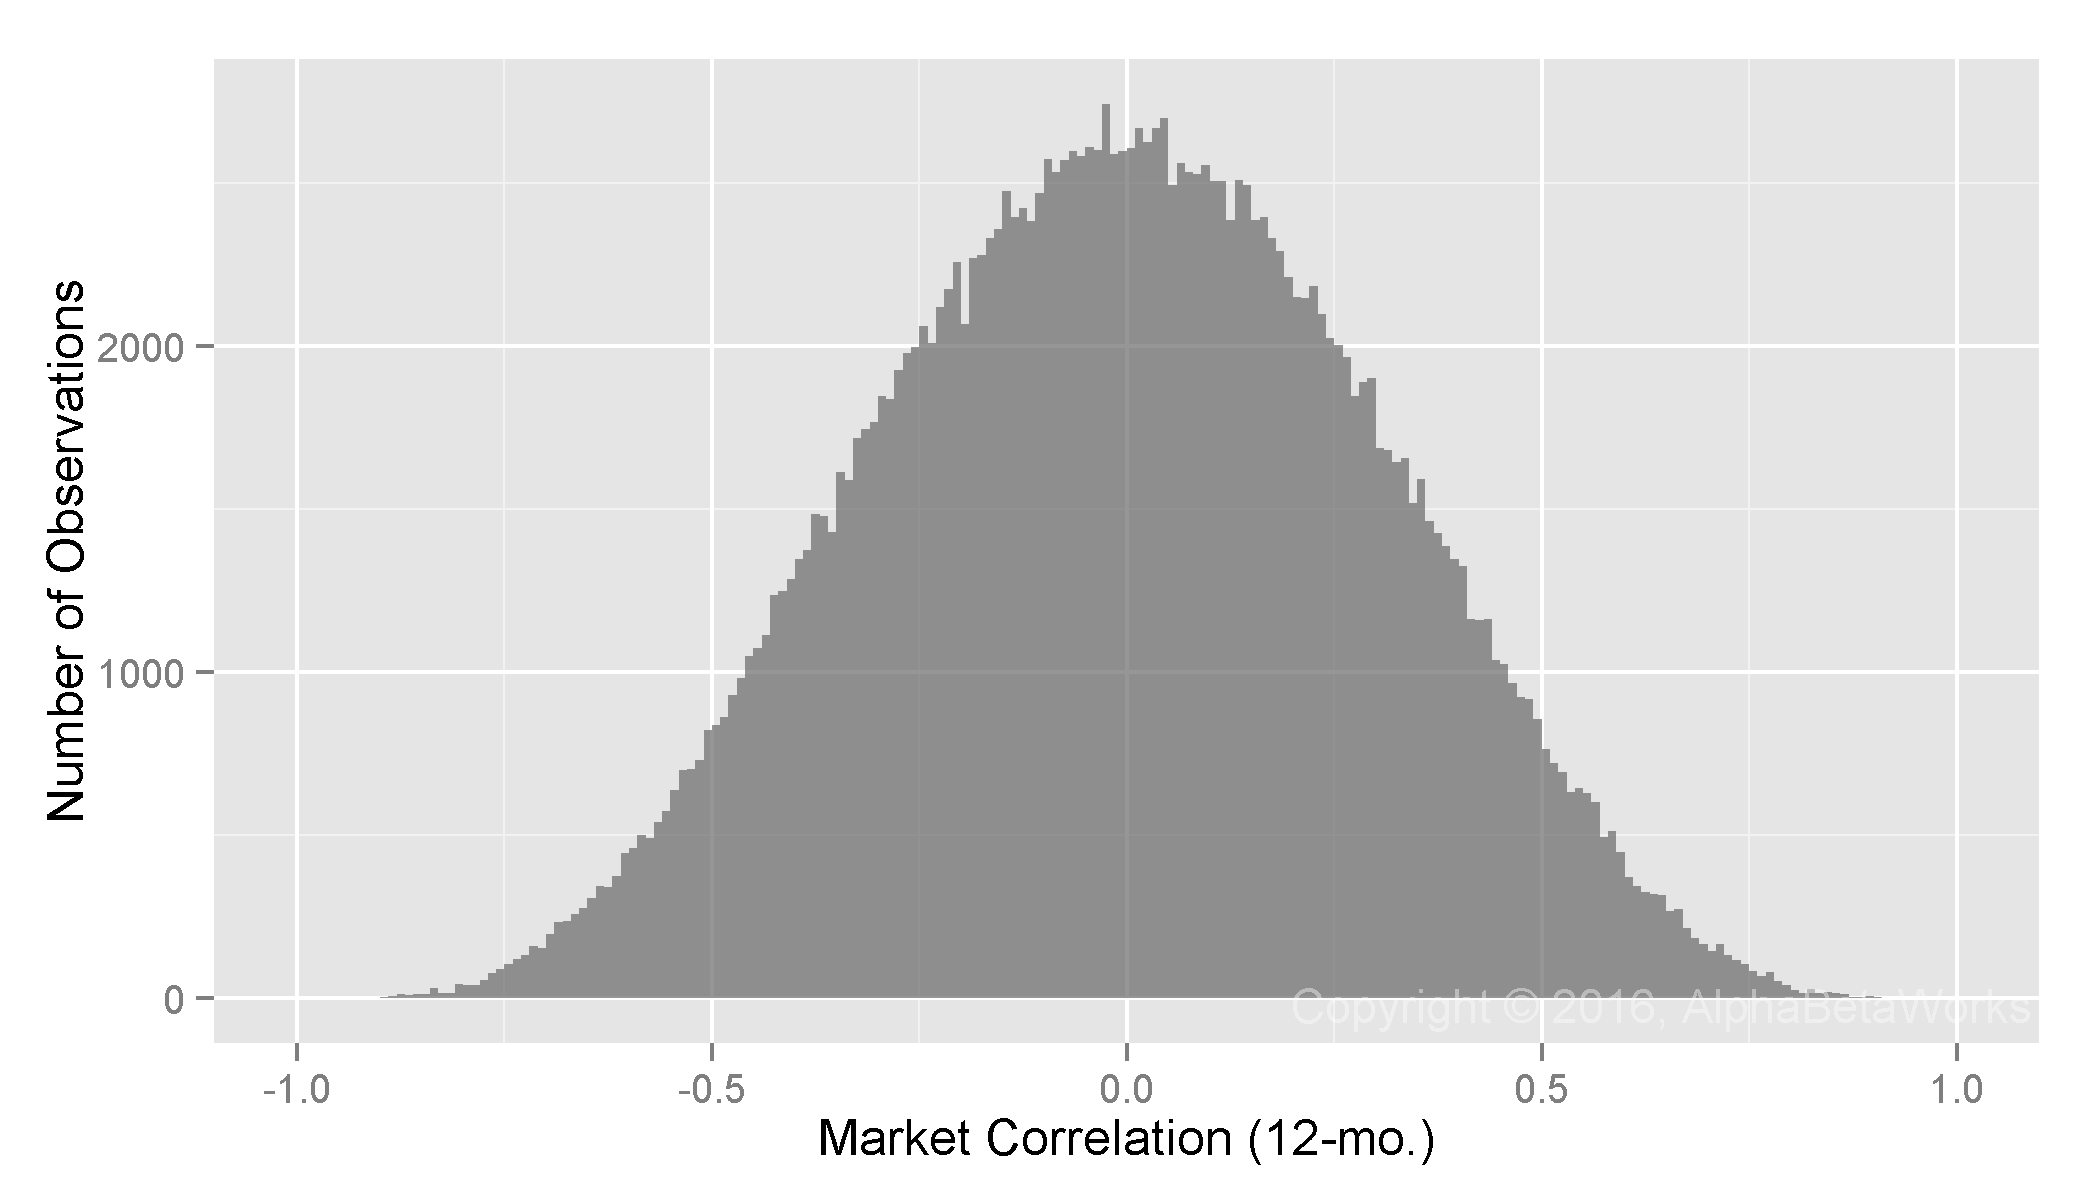
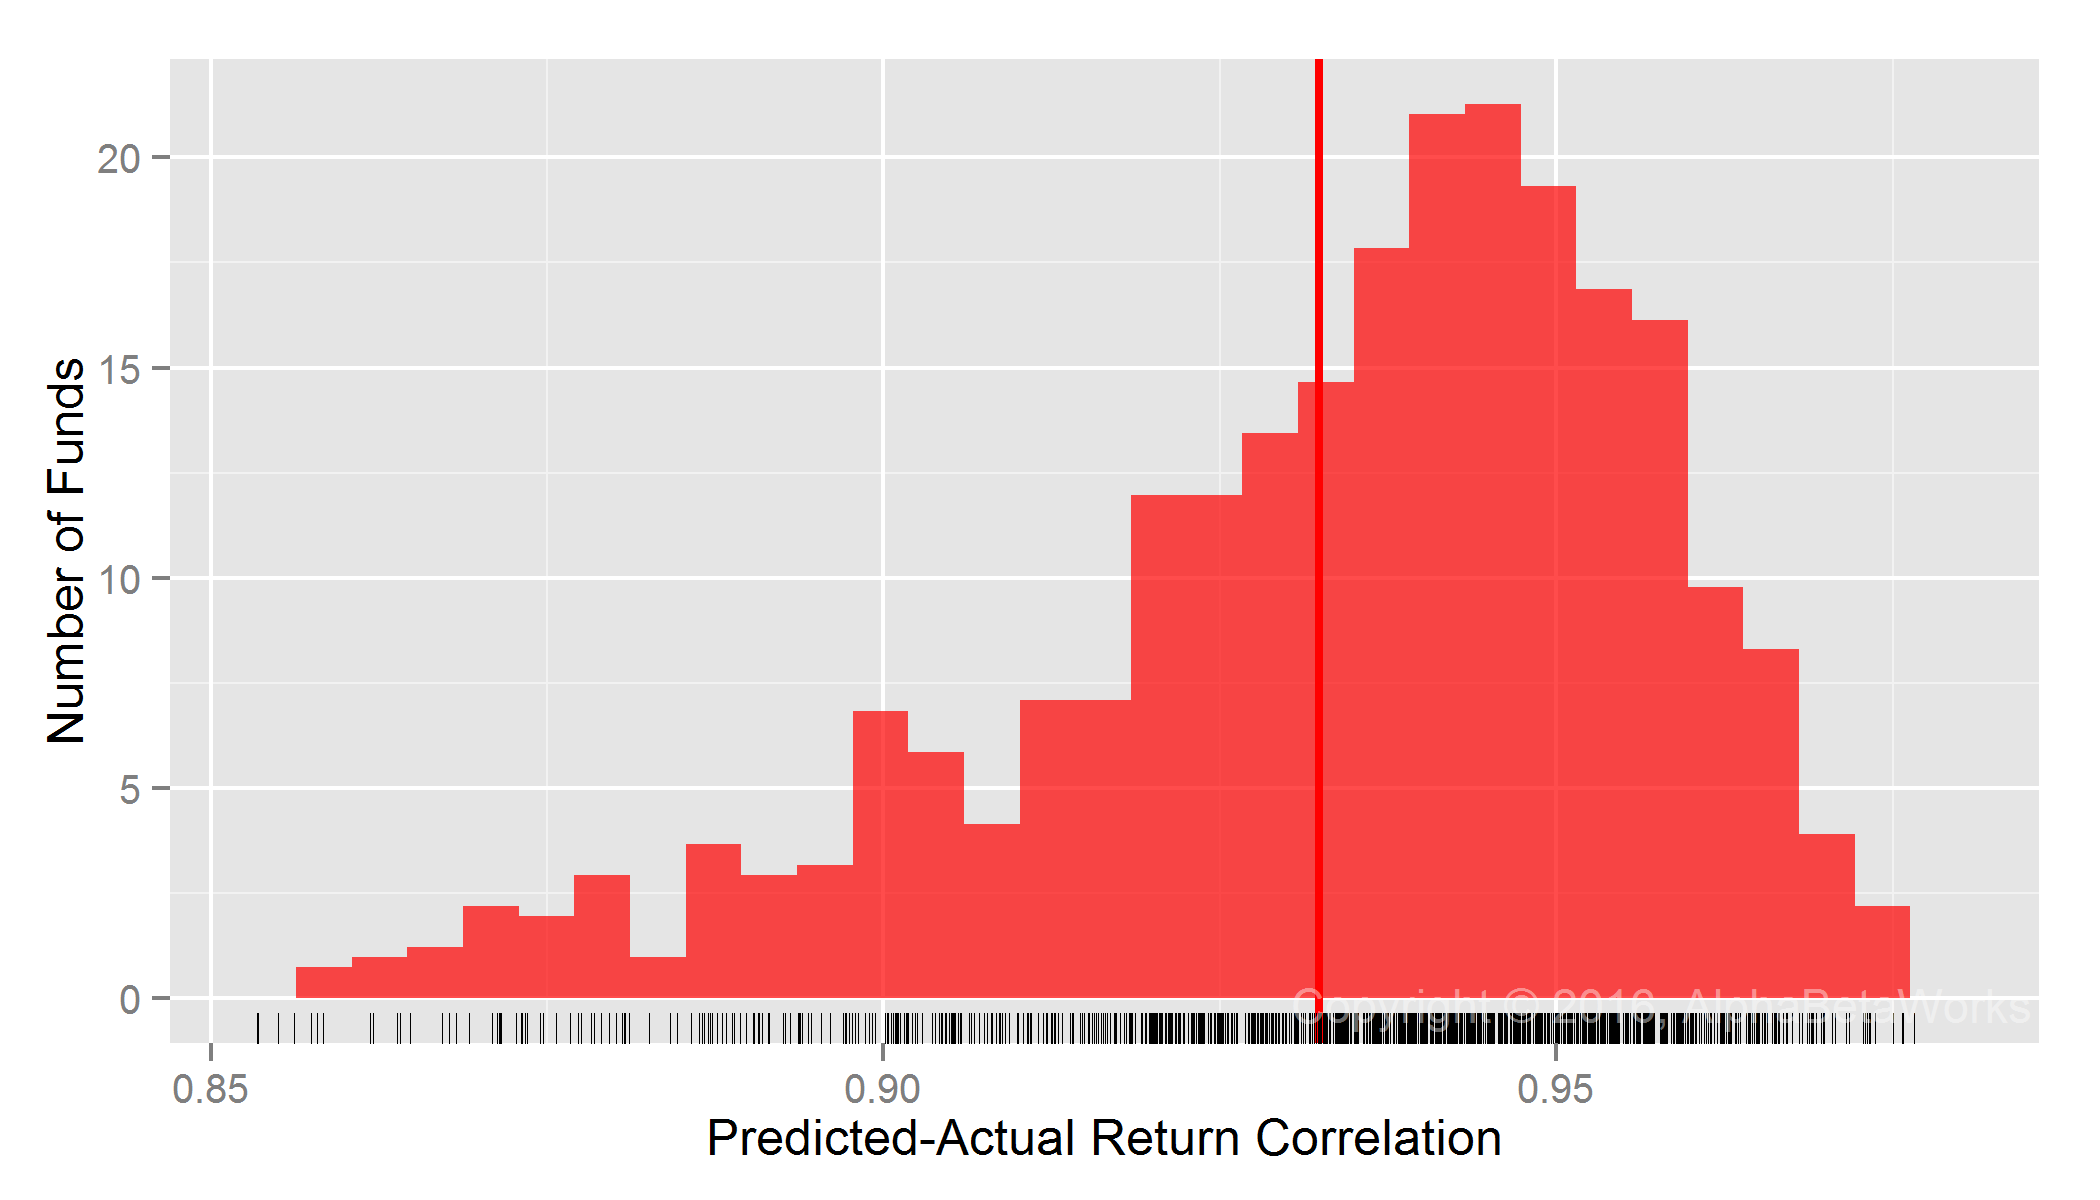
A large return dataset, even when perfectly random, will contain some subsets with high market correlations. To control for this, we generate random return samples (observations) and calculate their market correlations. These results, attainable only with a perfect hedge, are the standard against which we evaluate equity market hedging techniques:
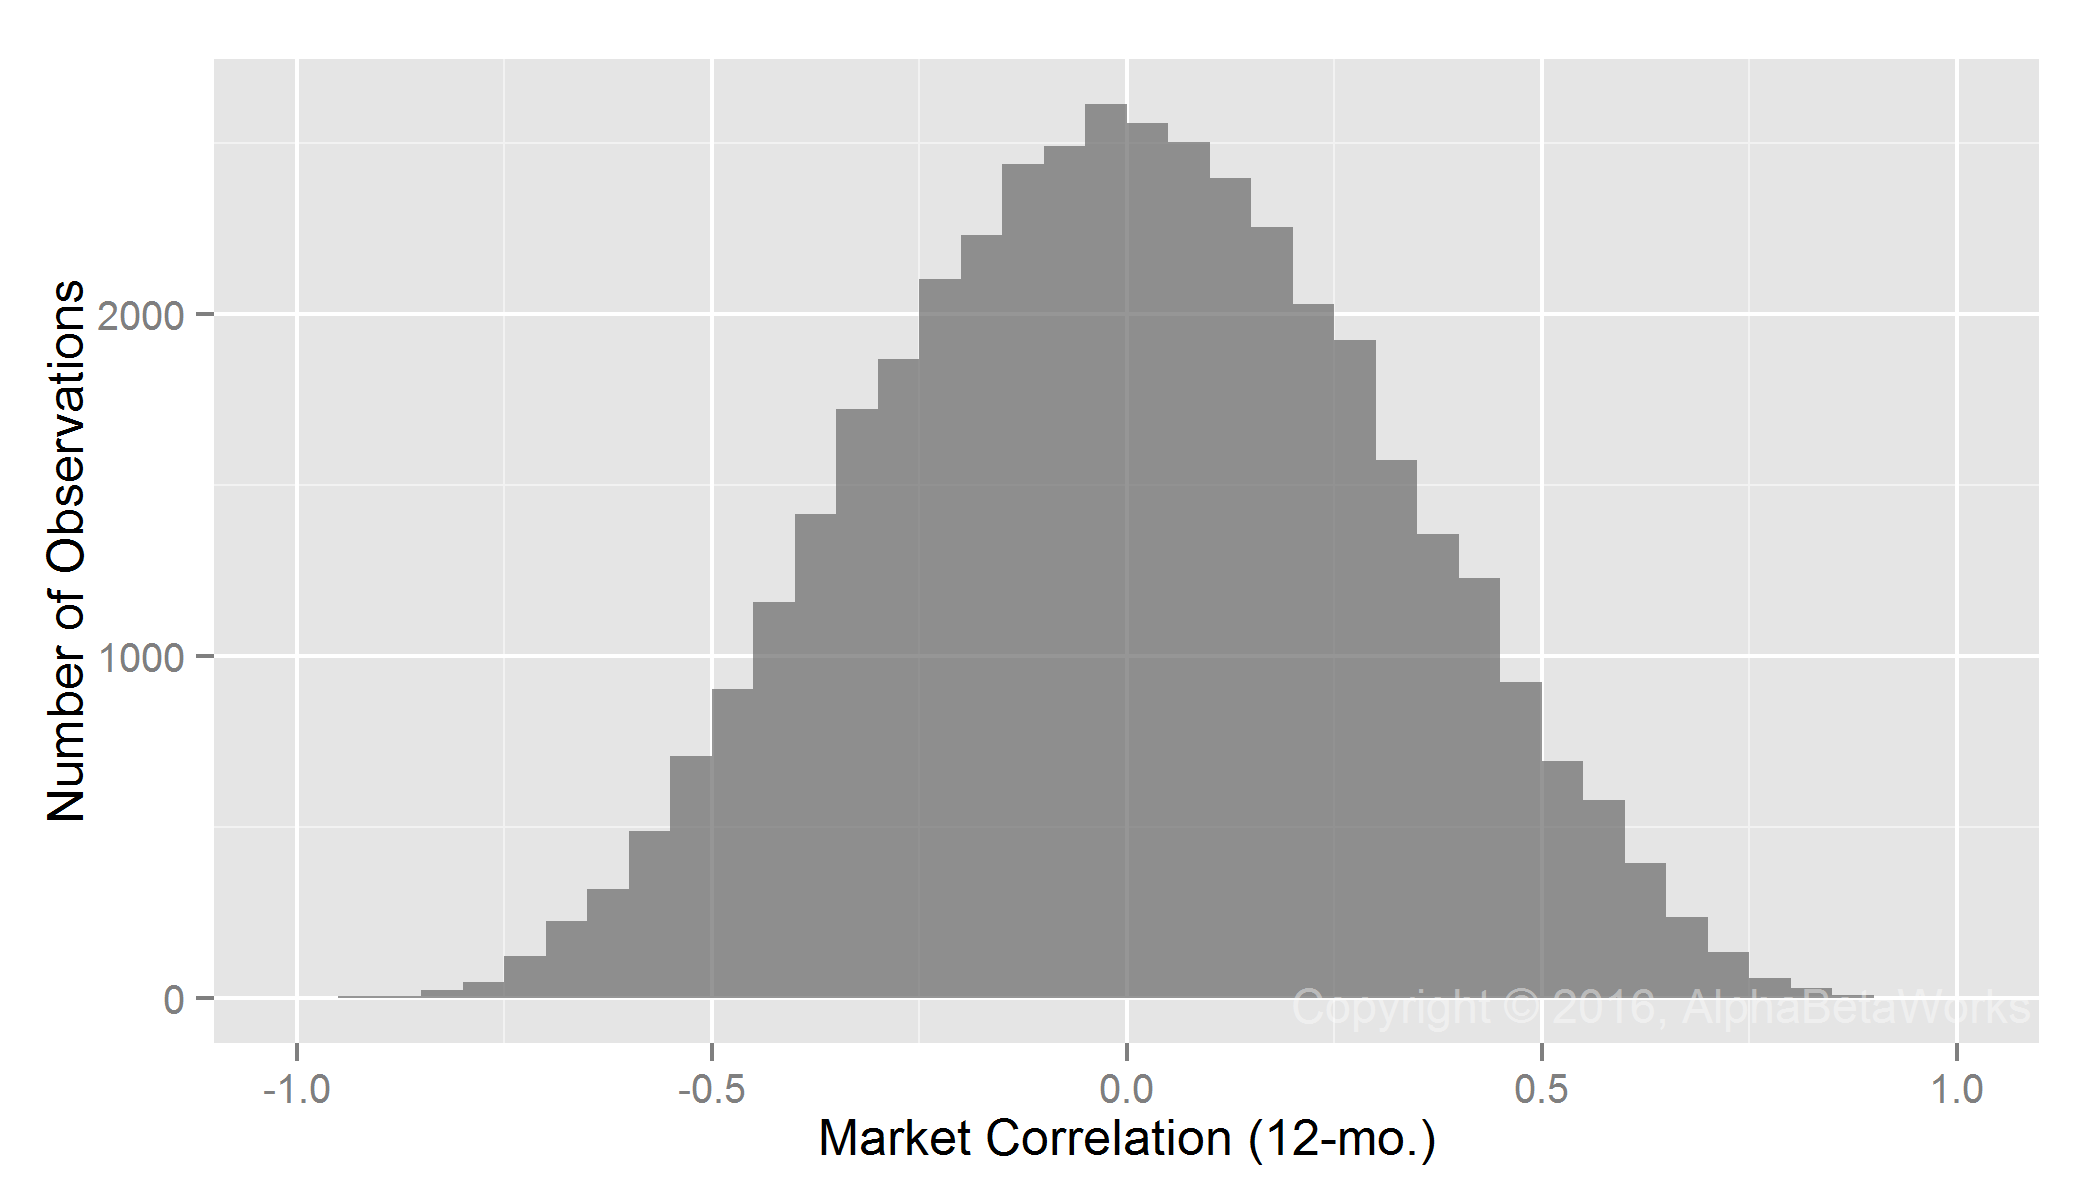
Realized 12-month market correlations of random return series
   Min. 1st Qu.  Median    Mean 3rd Qu.    Max.
-0.9374 -0.2157 -0.0001  0.0022  0.2173  0.9190
Realized Market Correlations of Portfolios Hedged using a 100% Market Short
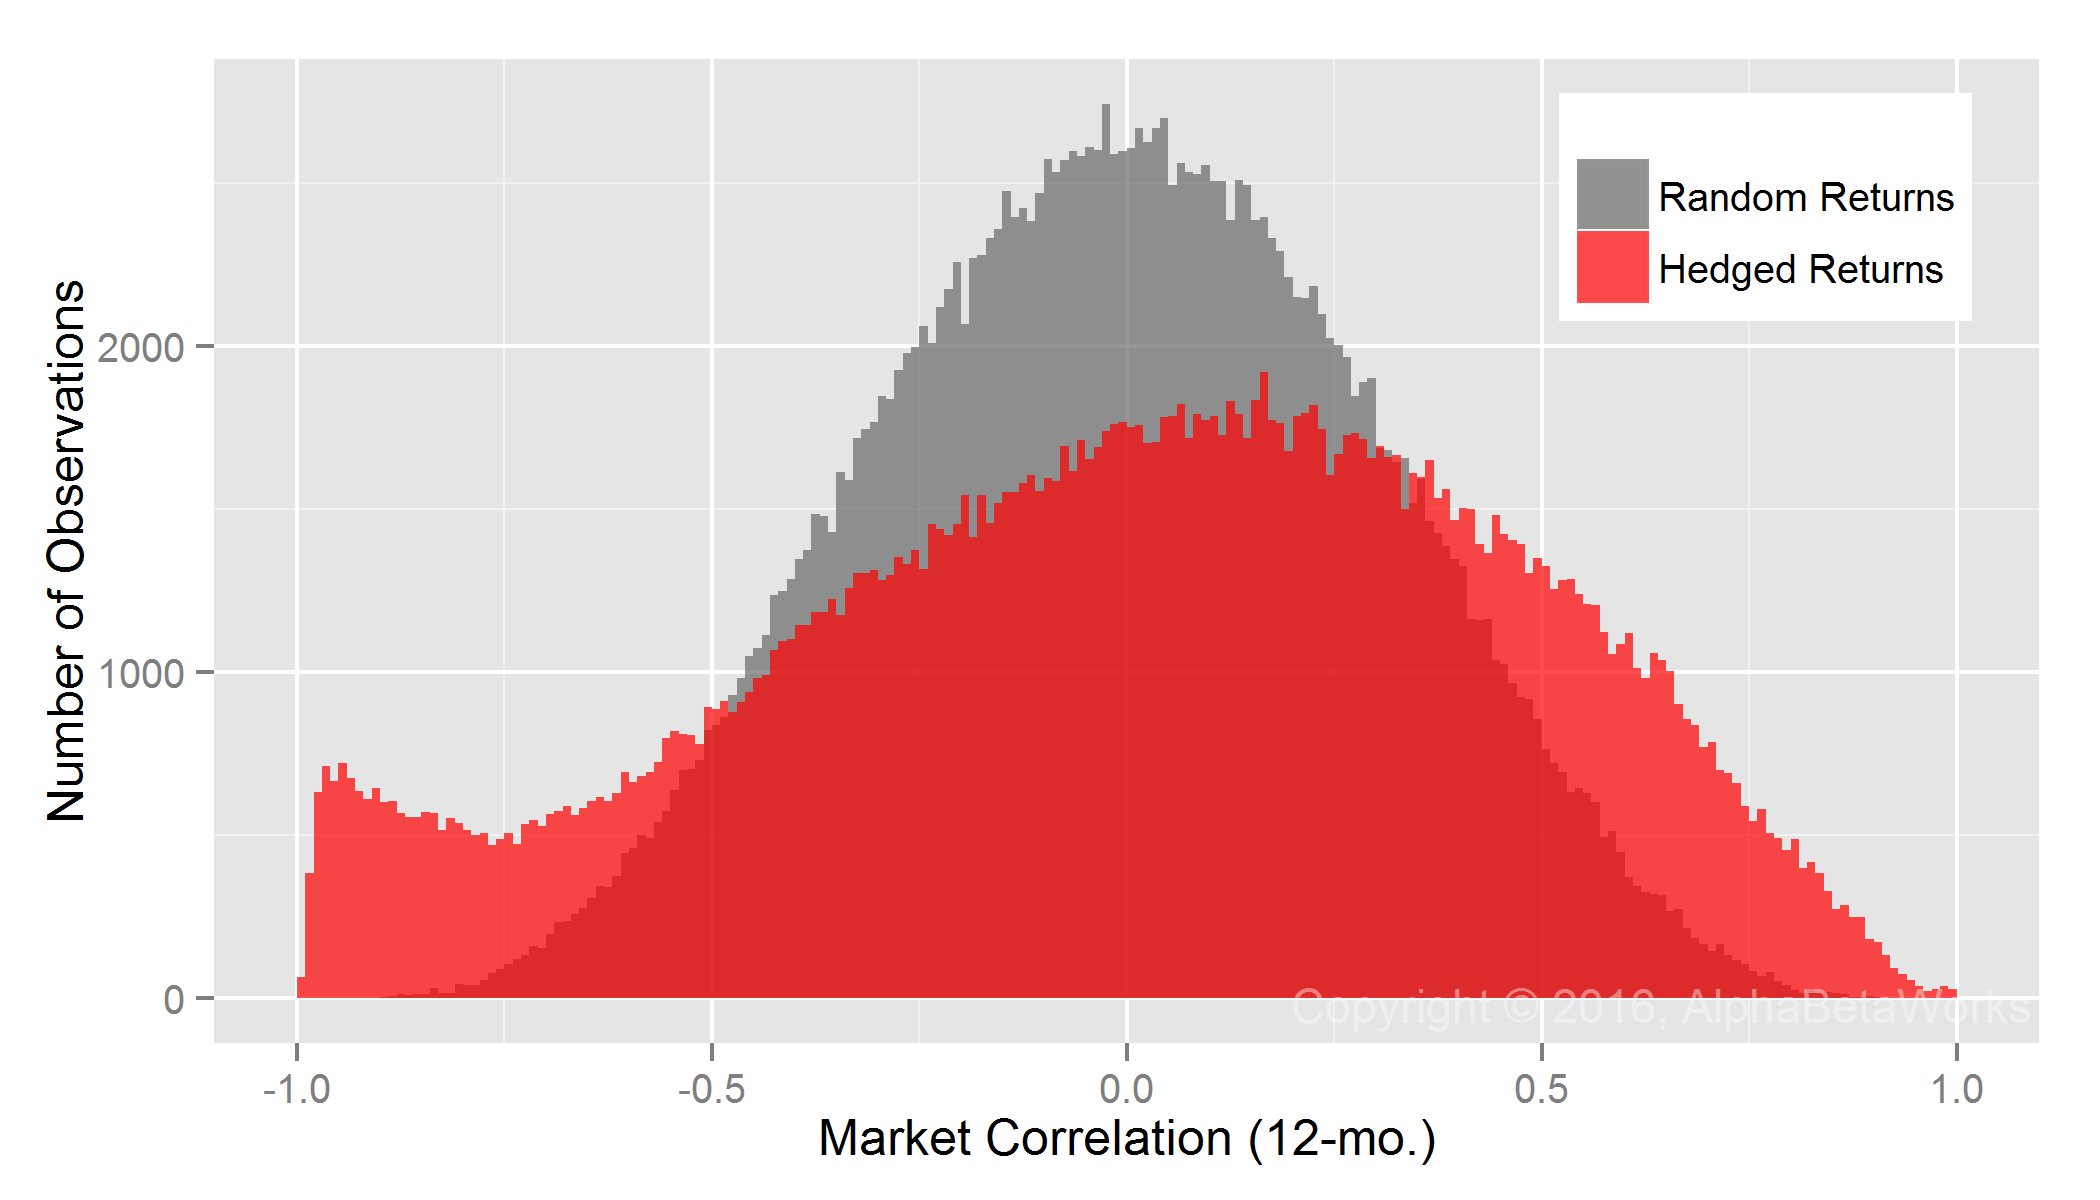
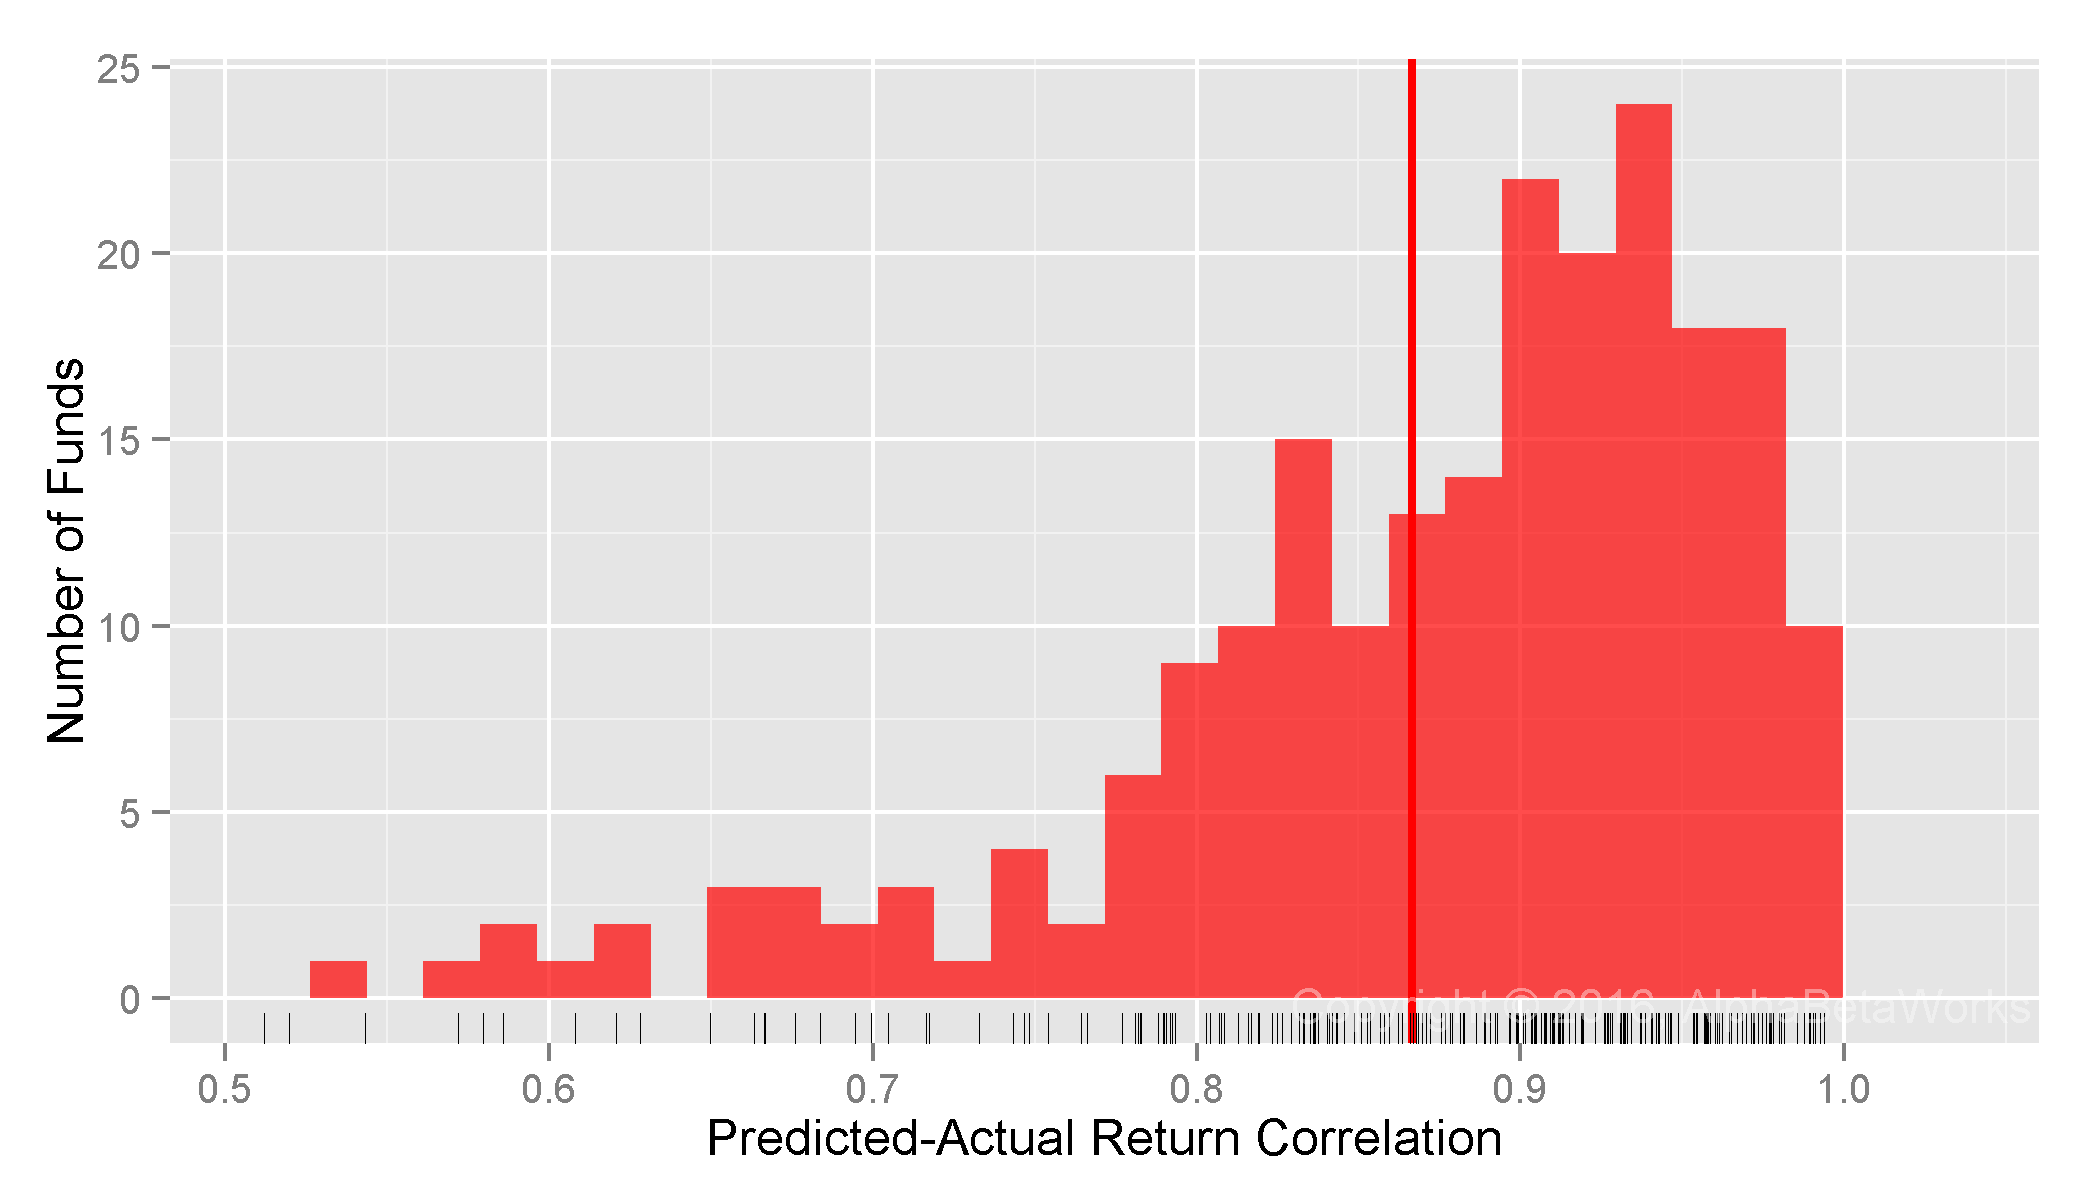
As with mutual funds, the assumption that all hedge fund long equity portfolios’ market exposures are 100% (market betas are 1) is flawed:
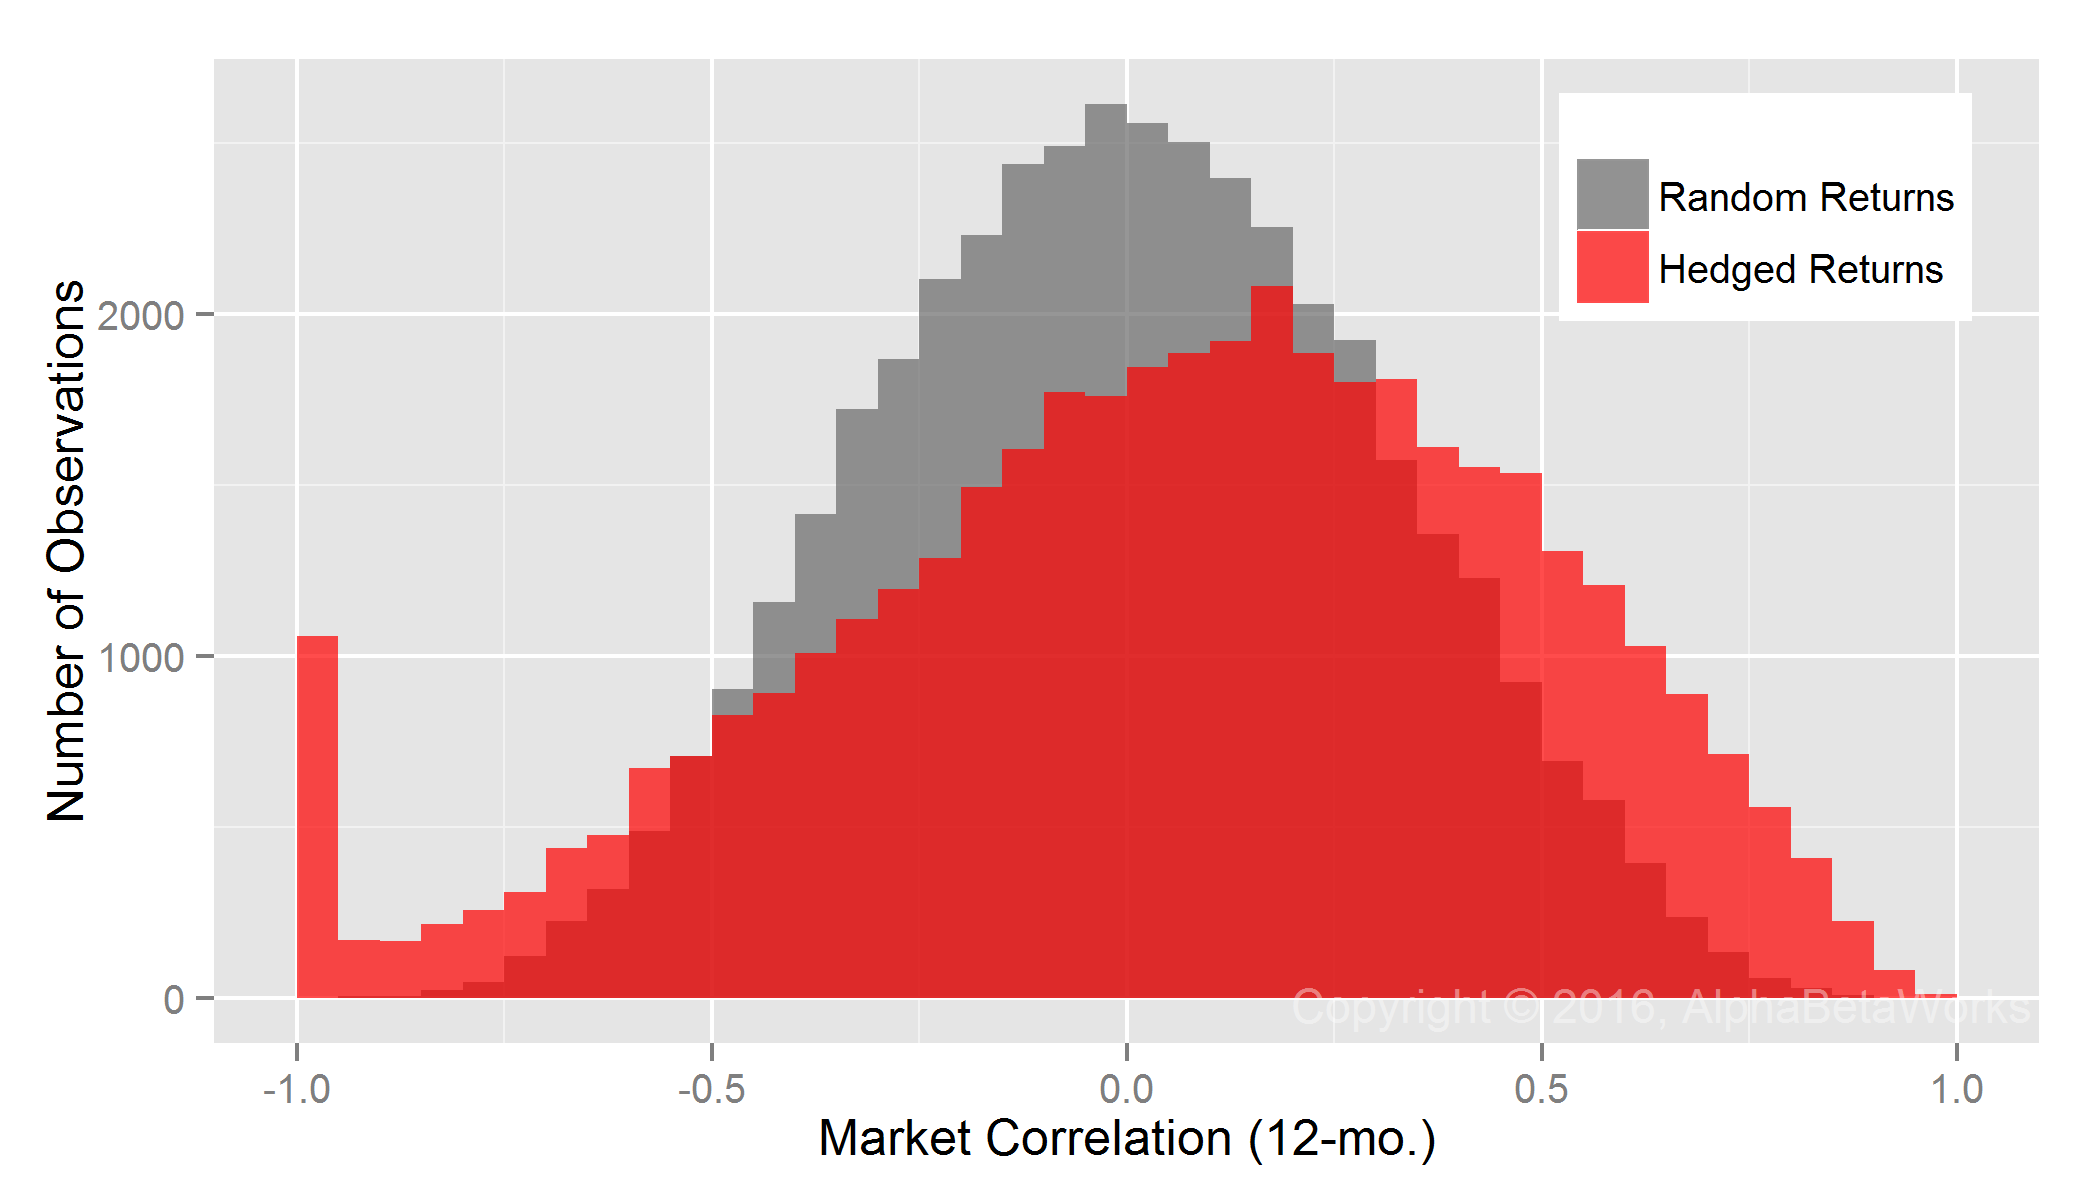
U.S. Long Equity Hedge Fund Portfolios: Realized 12-month market correlations of portfolios hedged using a 100% market short
   Min. 1st Qu.  Median    Mean 3rd Qu.    Max.
-0.9999 -0.2131  0.0927  0.0578  0.3706  0.9789
A 100% hedge is too small for high-risk portfolios and too large for low-risk ones. Also as seen for mutual funds, some hedged low-exposure portfolios formed a fat tail of nearly -1 realized market correlations.
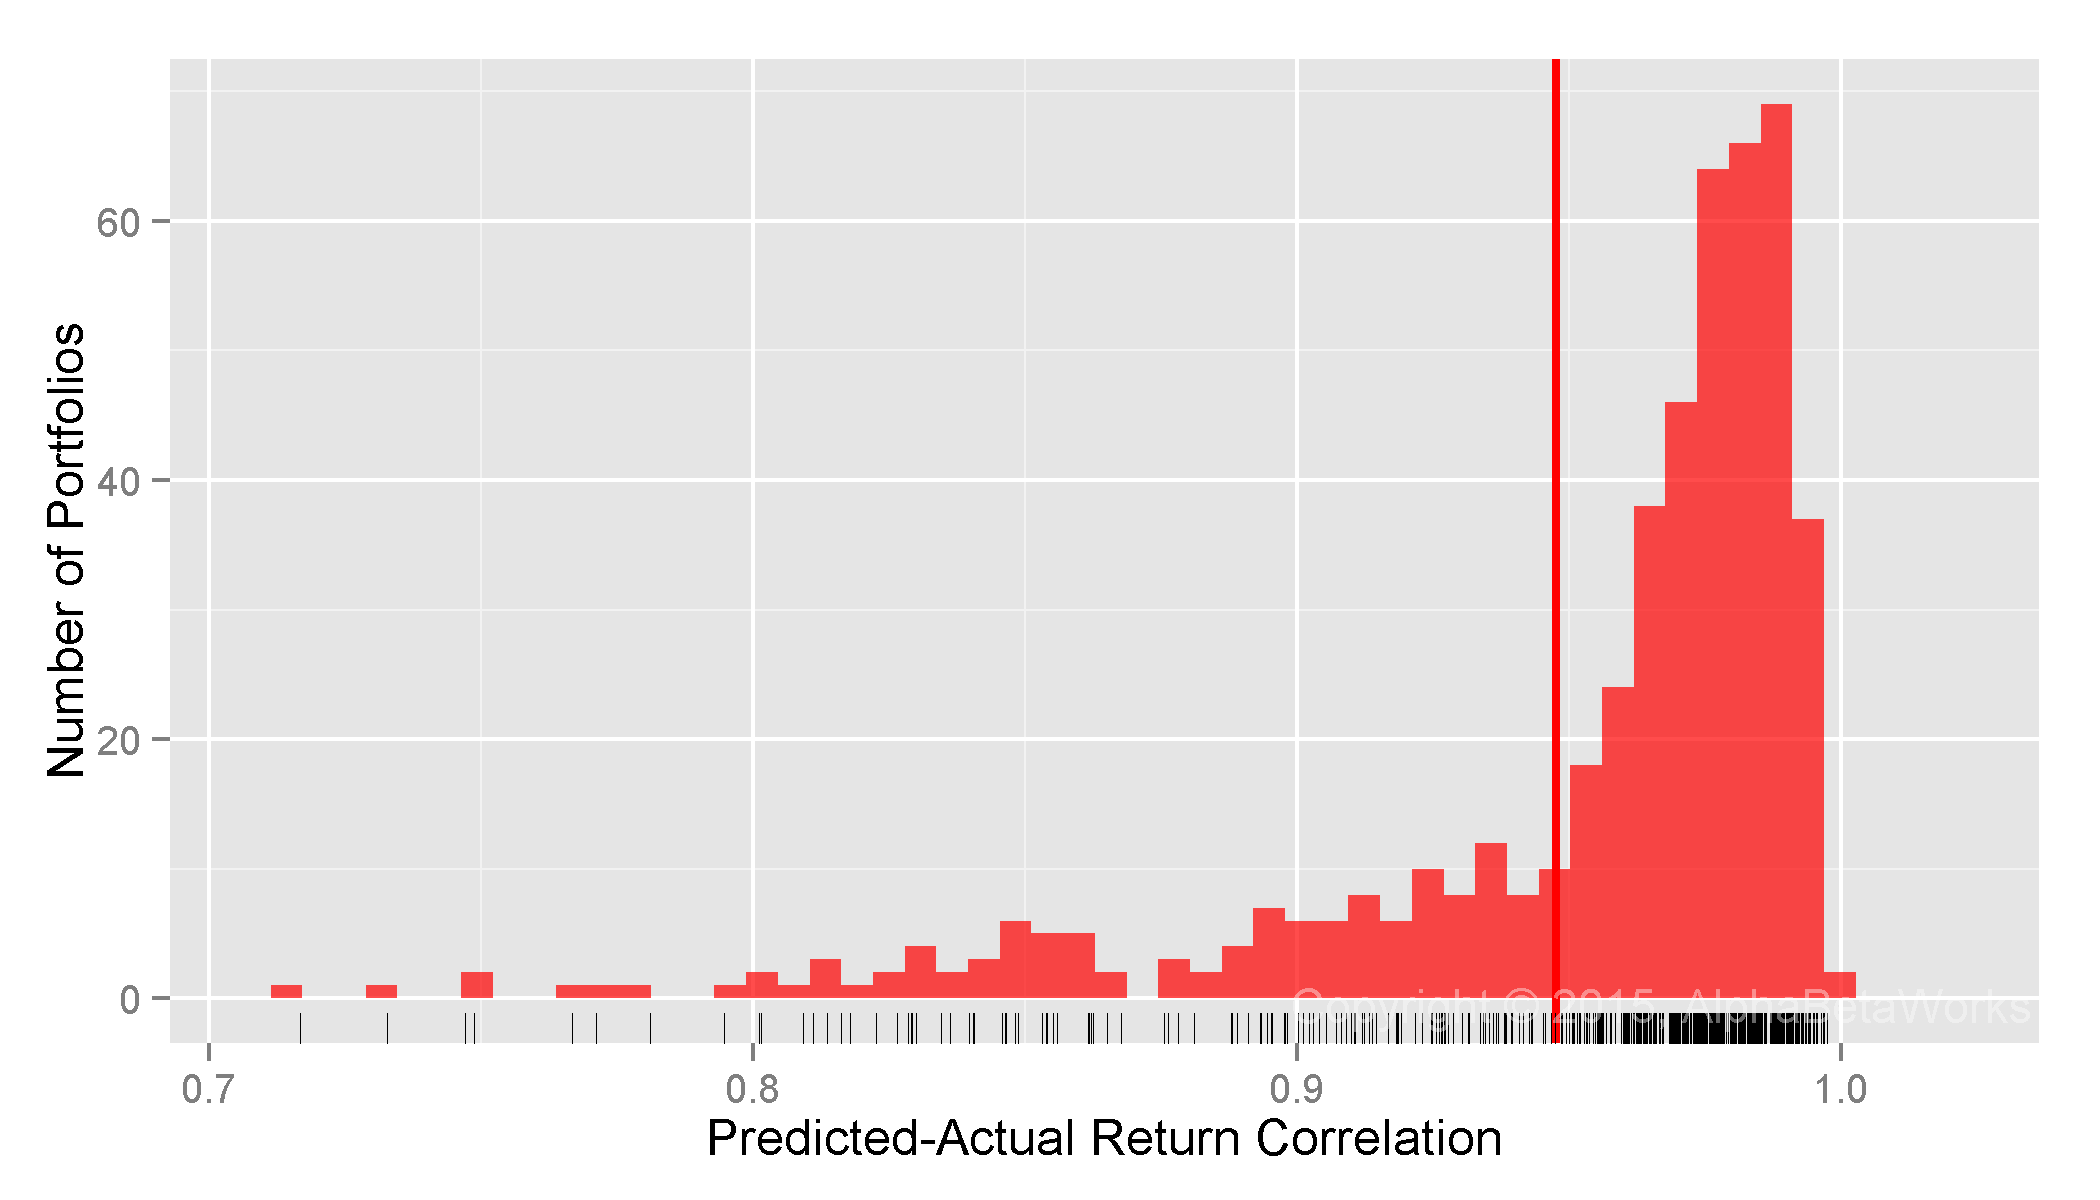
Realized Market Correlations of Portfolios Hedged using Returns-Based Analysis
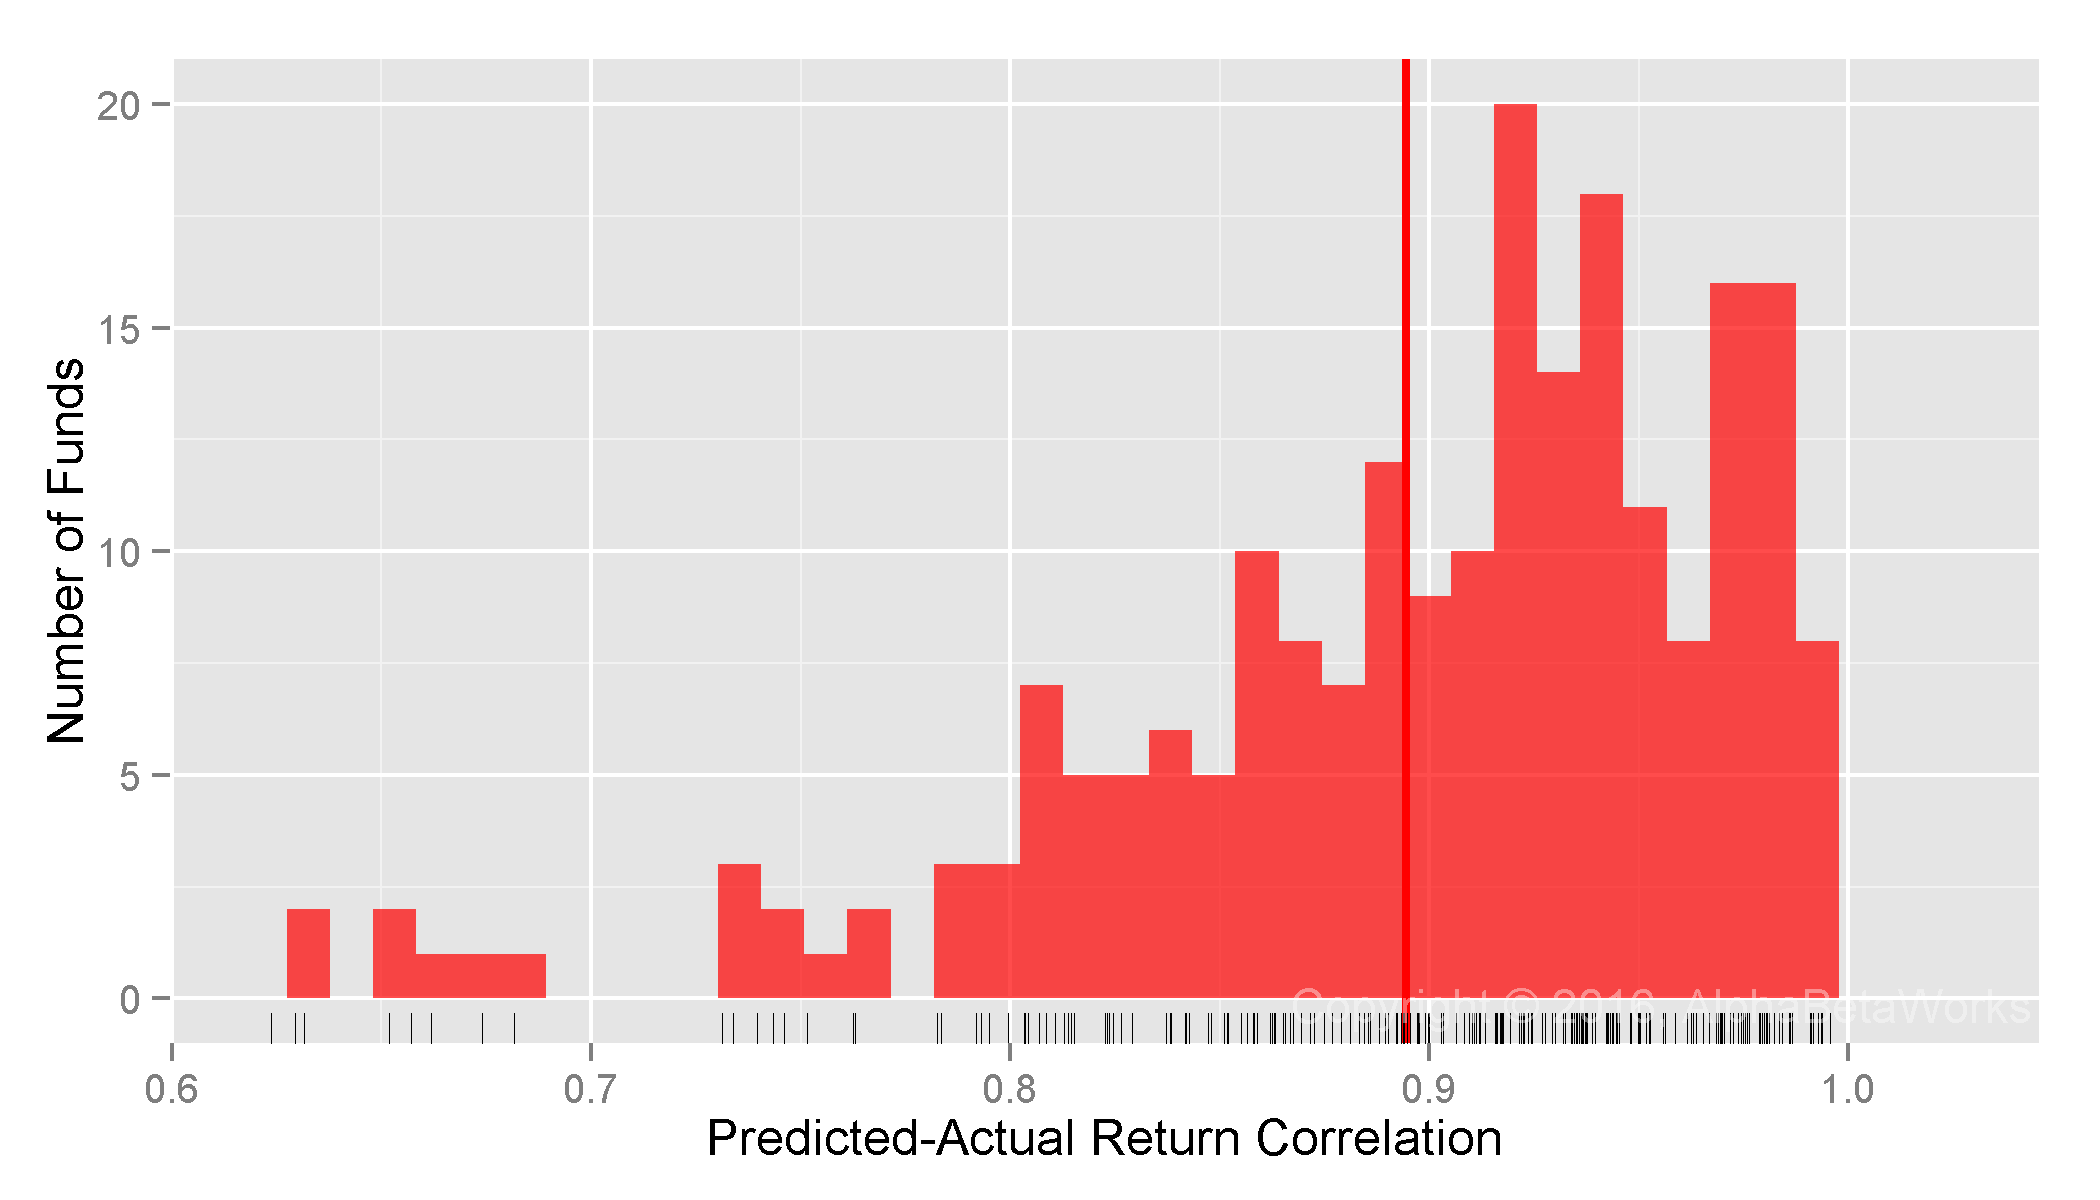
Most RBSA assumes that portfolio factor exposures are constant over the regression window. Some advanced techniques may allow for random variation in exposures over the window, yet even this relaxed assumption is flawed. Our earlier posts covered the problems that arise when RBSA fails to detect rapid changes in portfolio risk. It turns out that the months or years of delay before RBSA captures changes in factor exposures are especially damaging when analyzing hedge fund portfolios:
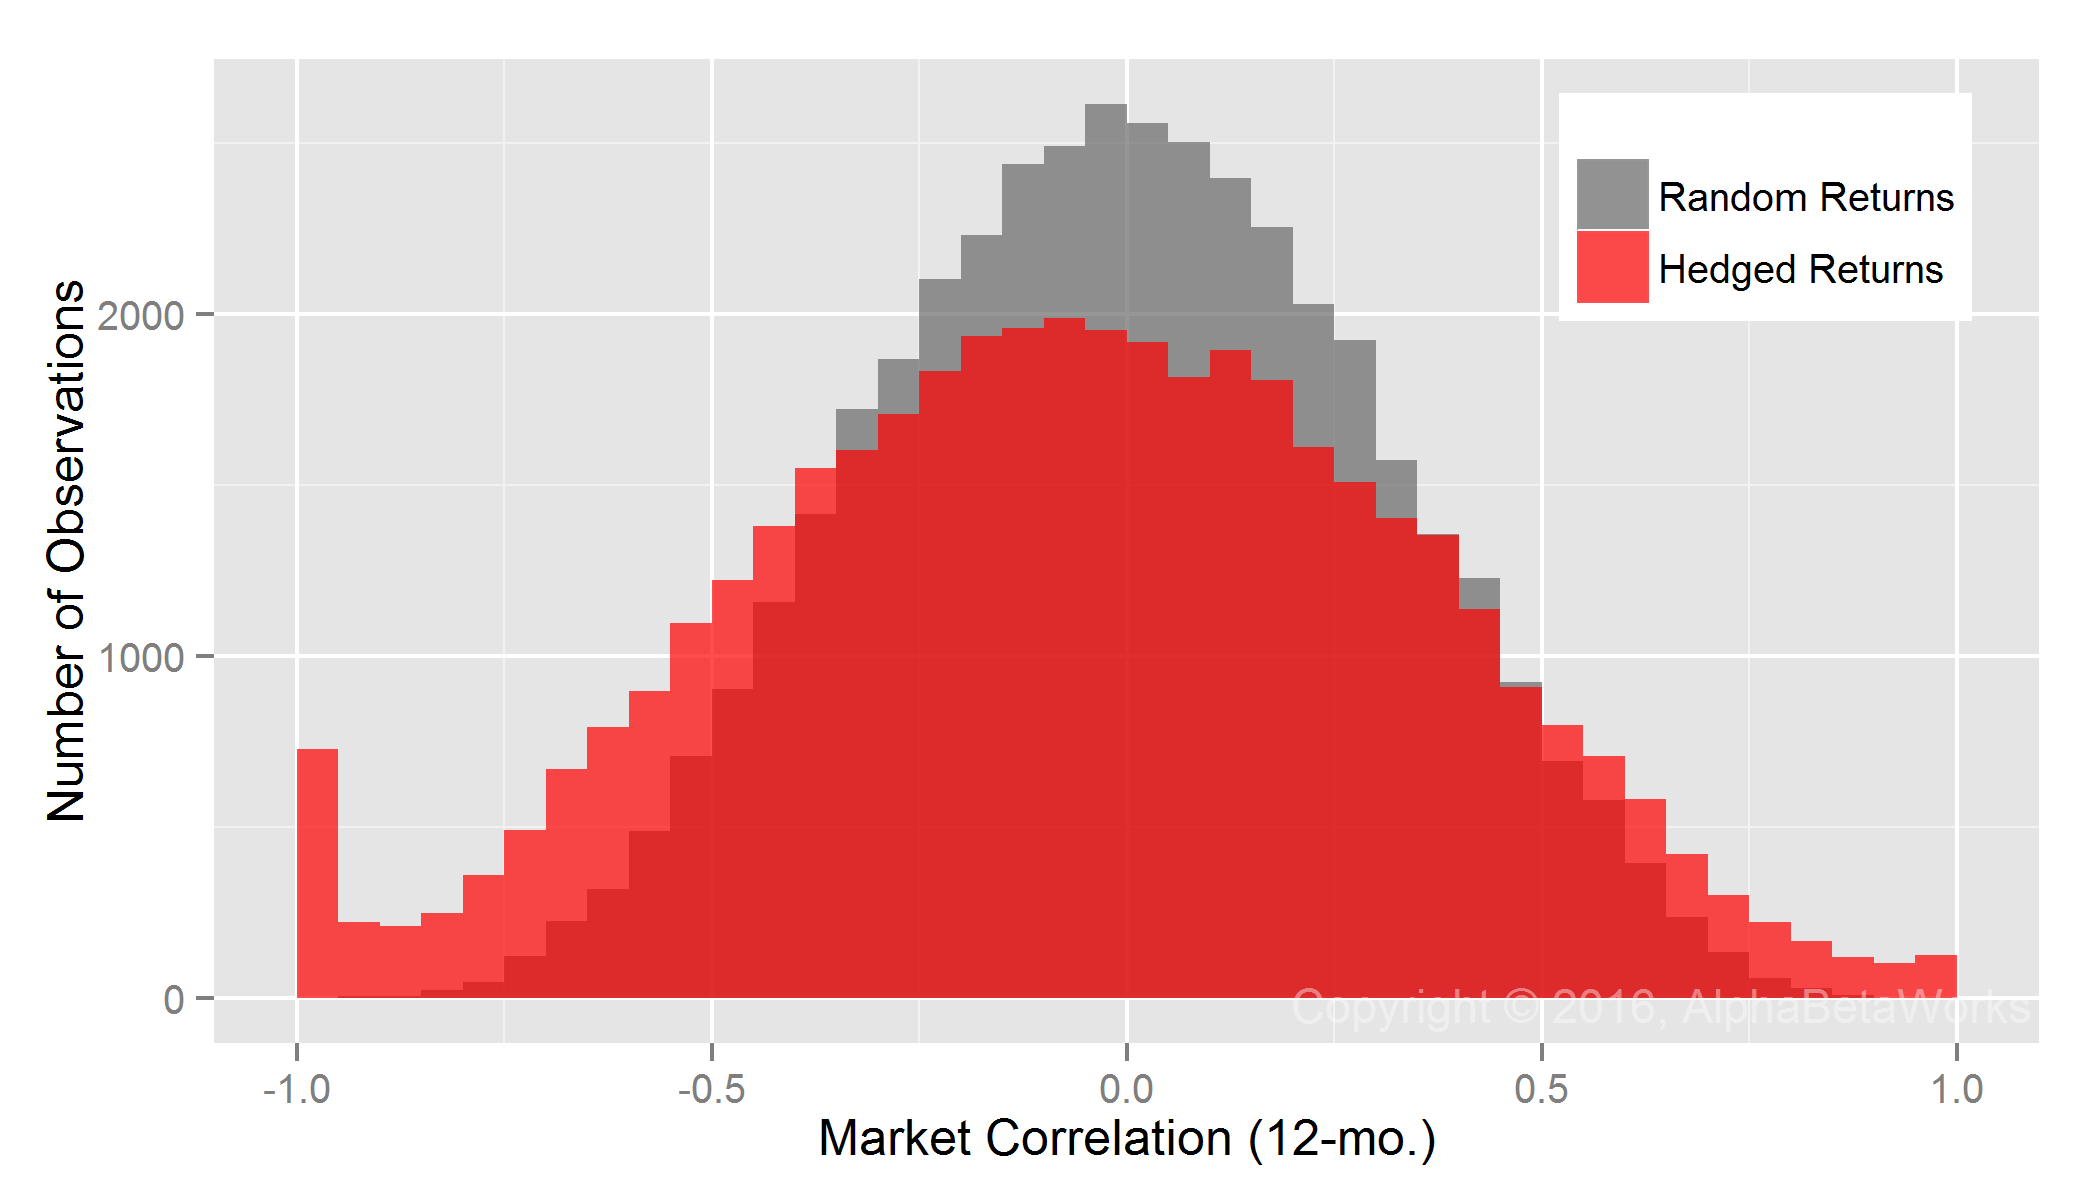
U.S. Long Equity Hedge Fund Portfolios: Realized 12-month market correlations of portfolios hedged using returns-based style analysis
   Min. 1st Qu.  Median    Mean 3rd Qu.    Max.
-0.9998 -0.3321 -0.0503 -0.0527  0.2311  0.9993
RBSA fails more severely for hedge funds than for mutual funds. In fact, RBSA has similar defect as a fixed 100% hedge for some low-exposure portfolios and produces a fat tail of nearly -1 market correlations. Hedge funds’ long equity portfolios can and do cut risk rapidly, so RBSA’s failure to detect these rapid exposure reductions is expected.
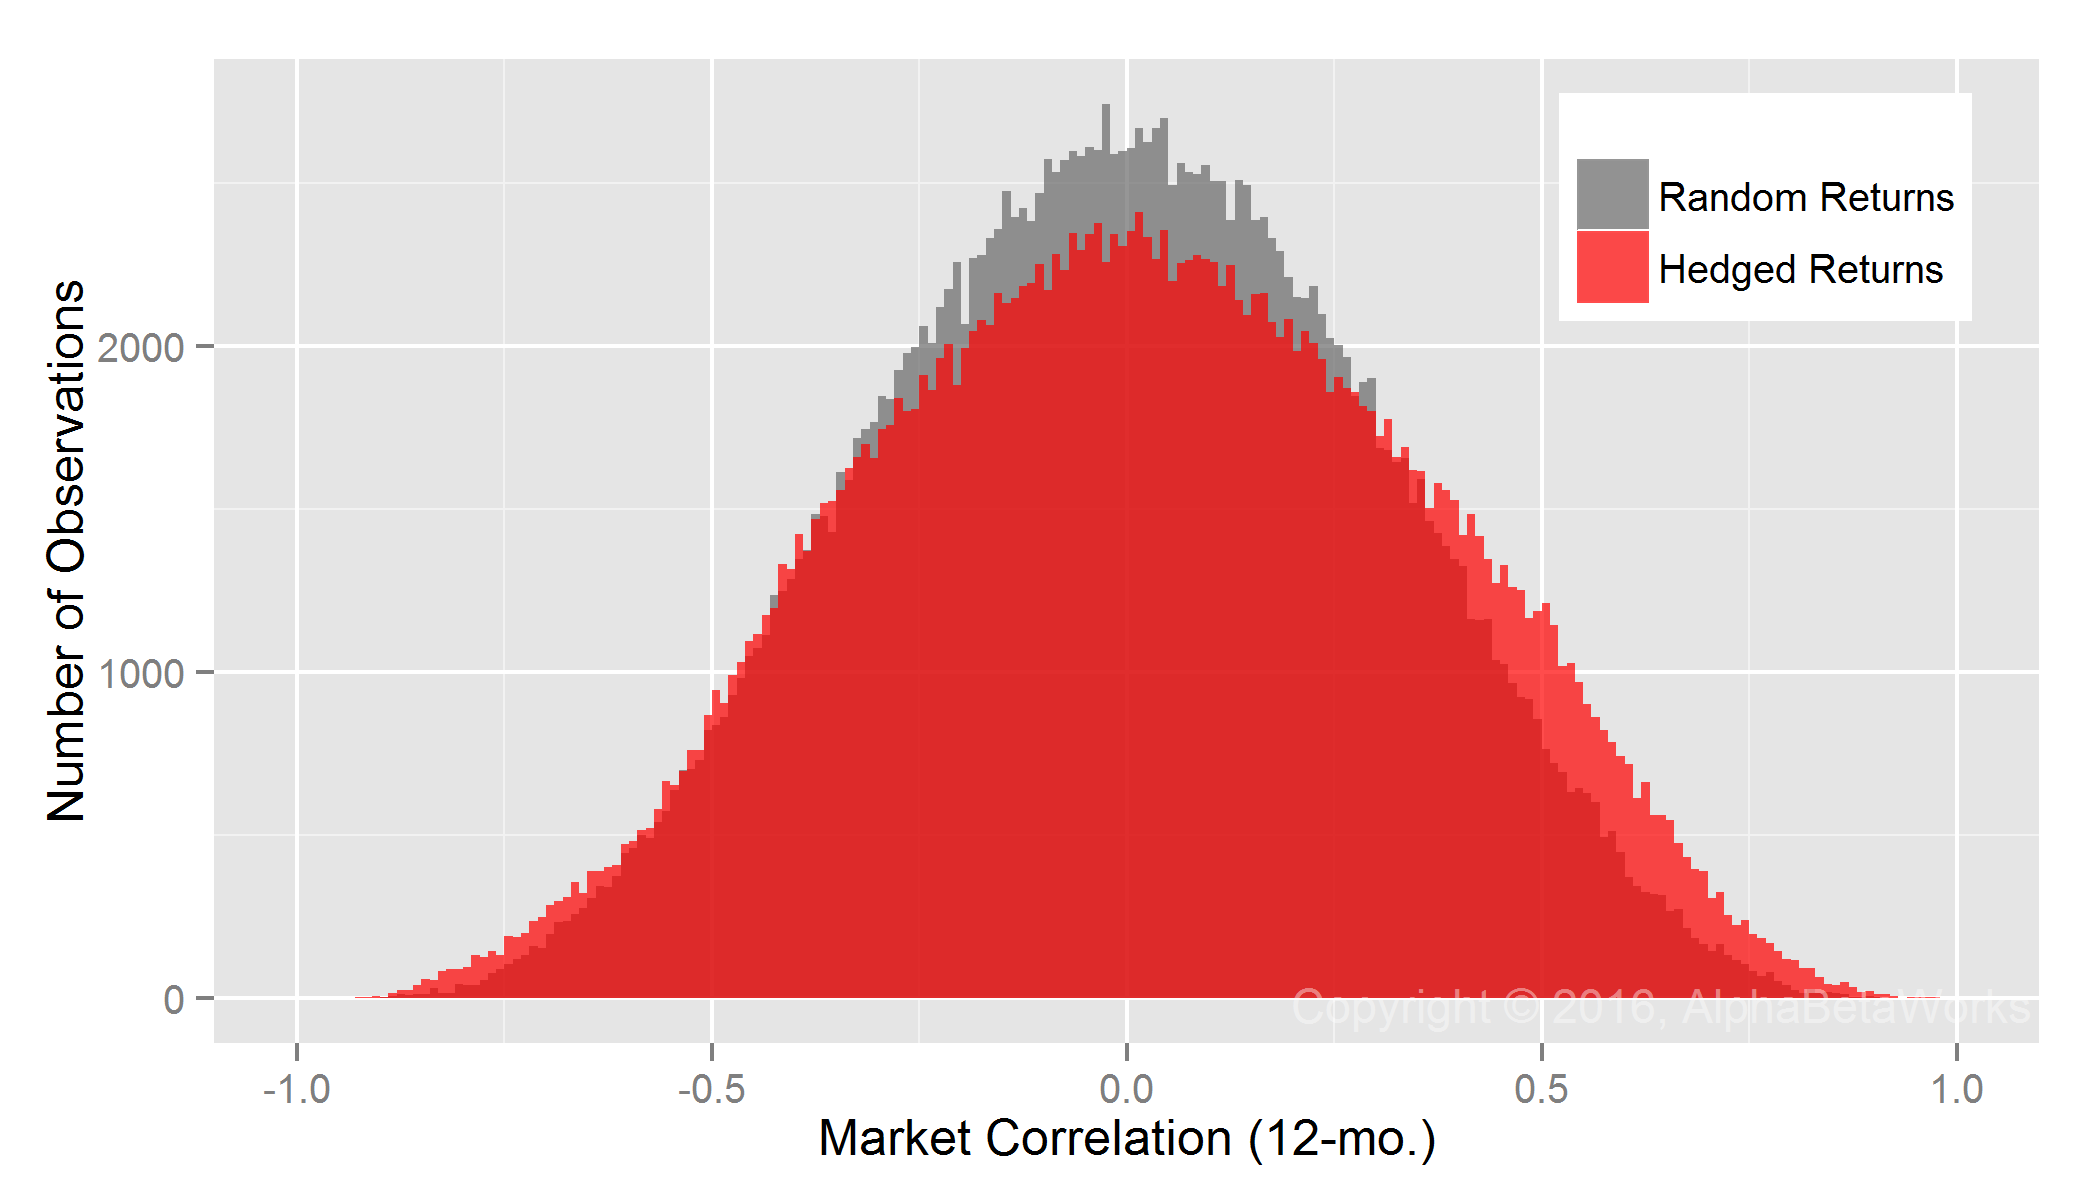
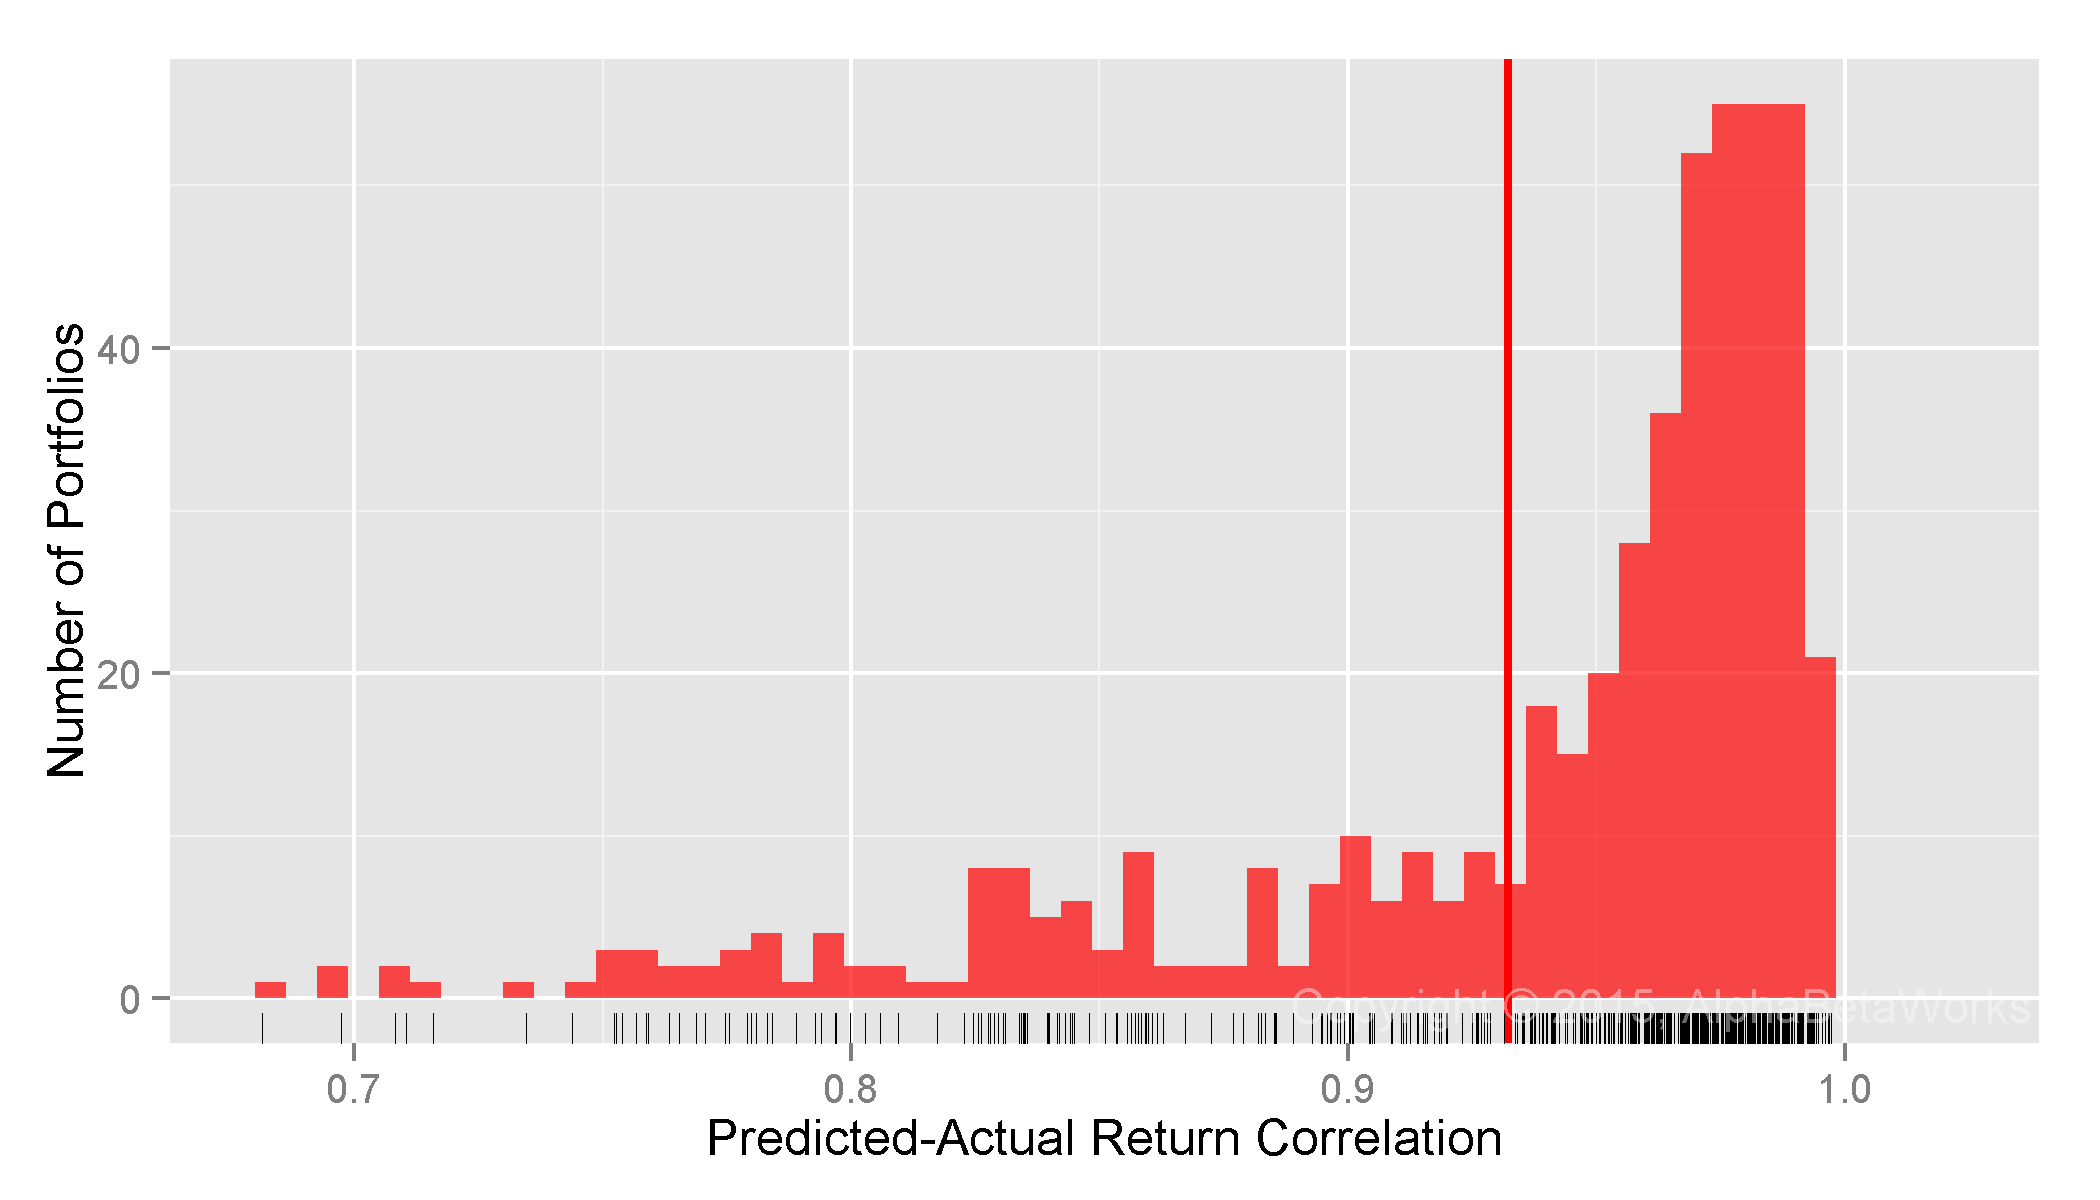
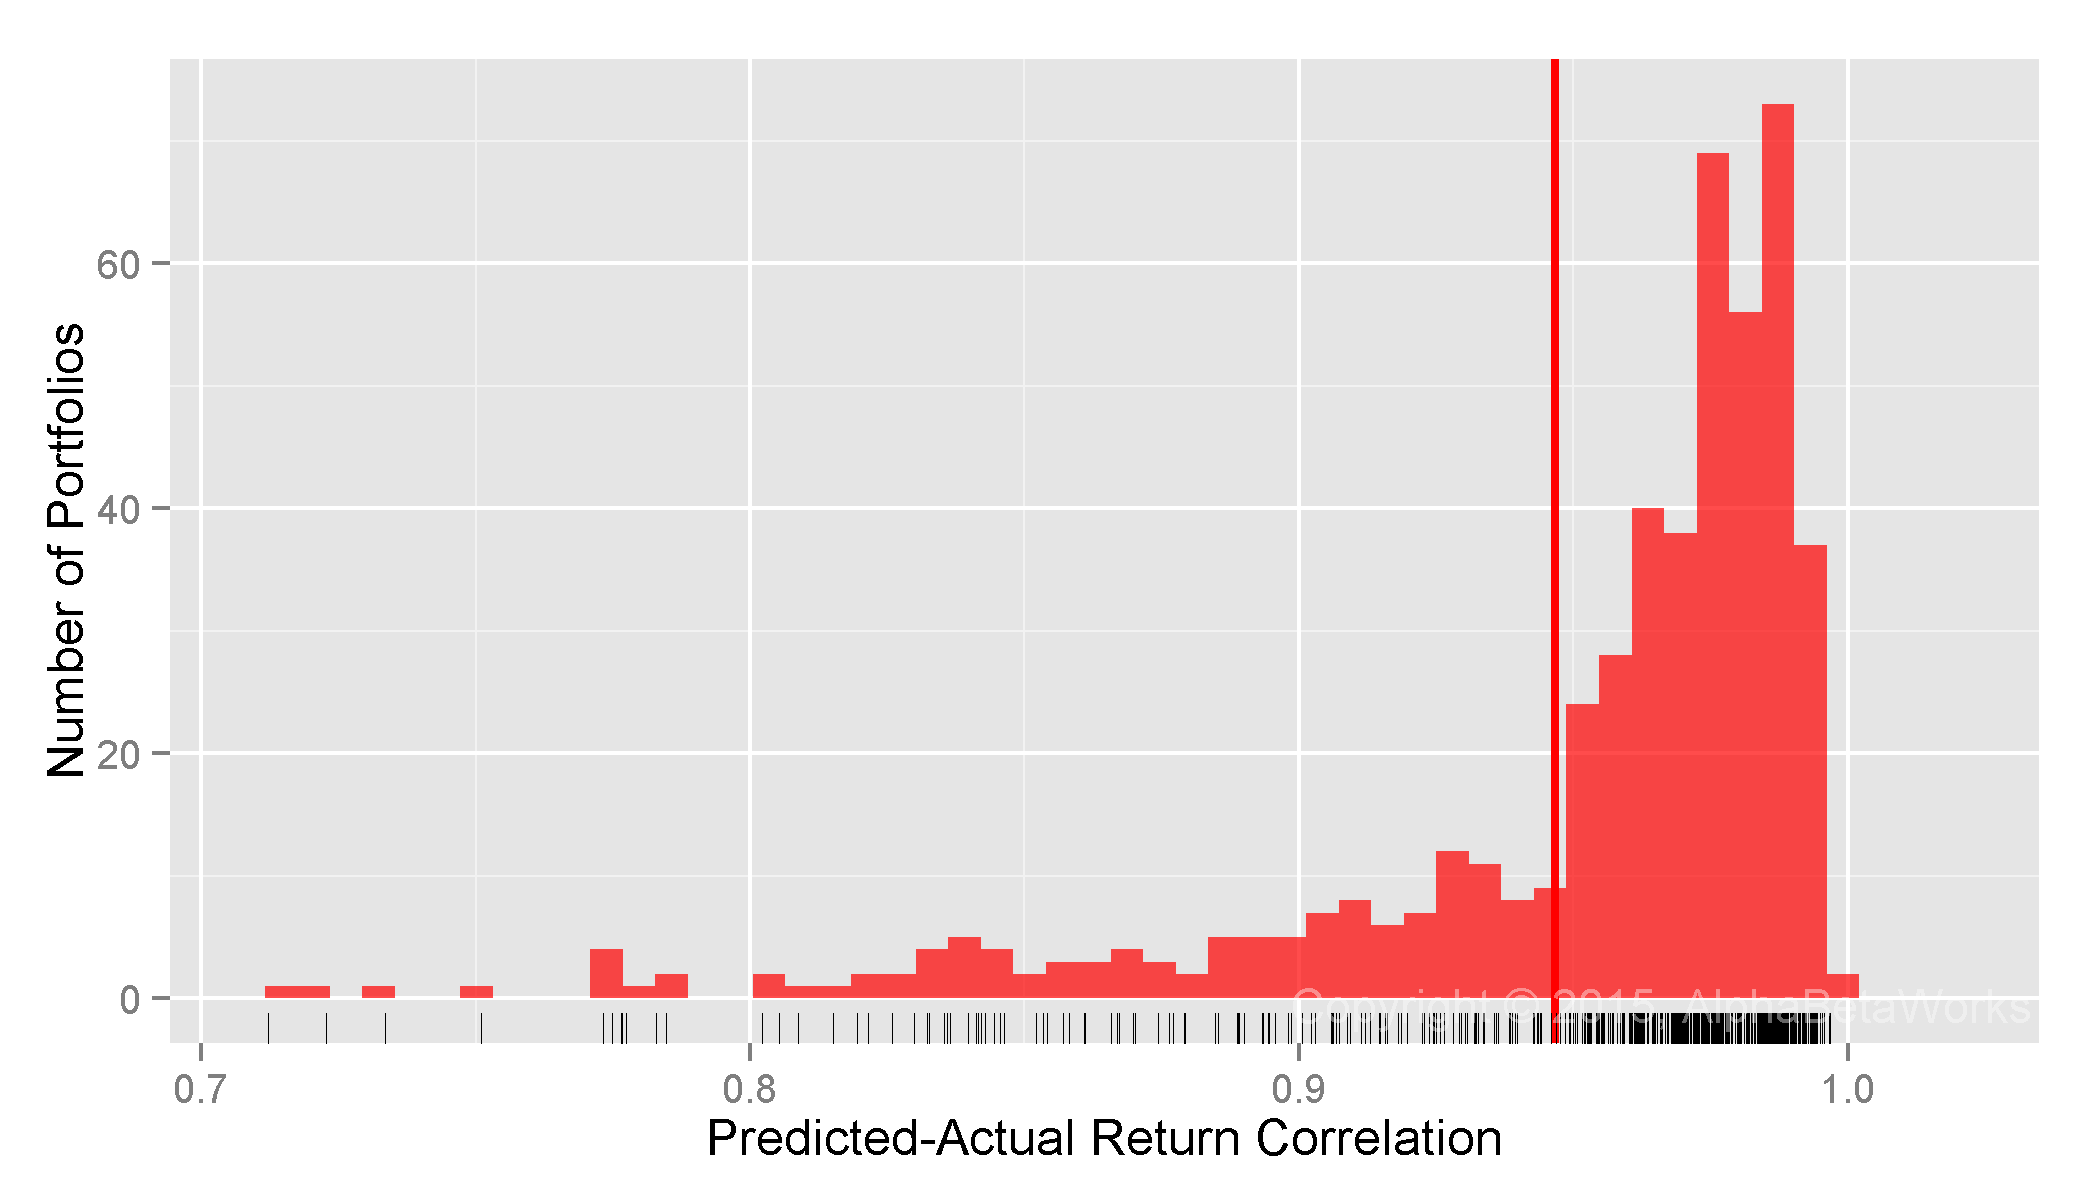
Realized Market Correlations of Portfolios Hedged using a Statistical Equity Risk Model
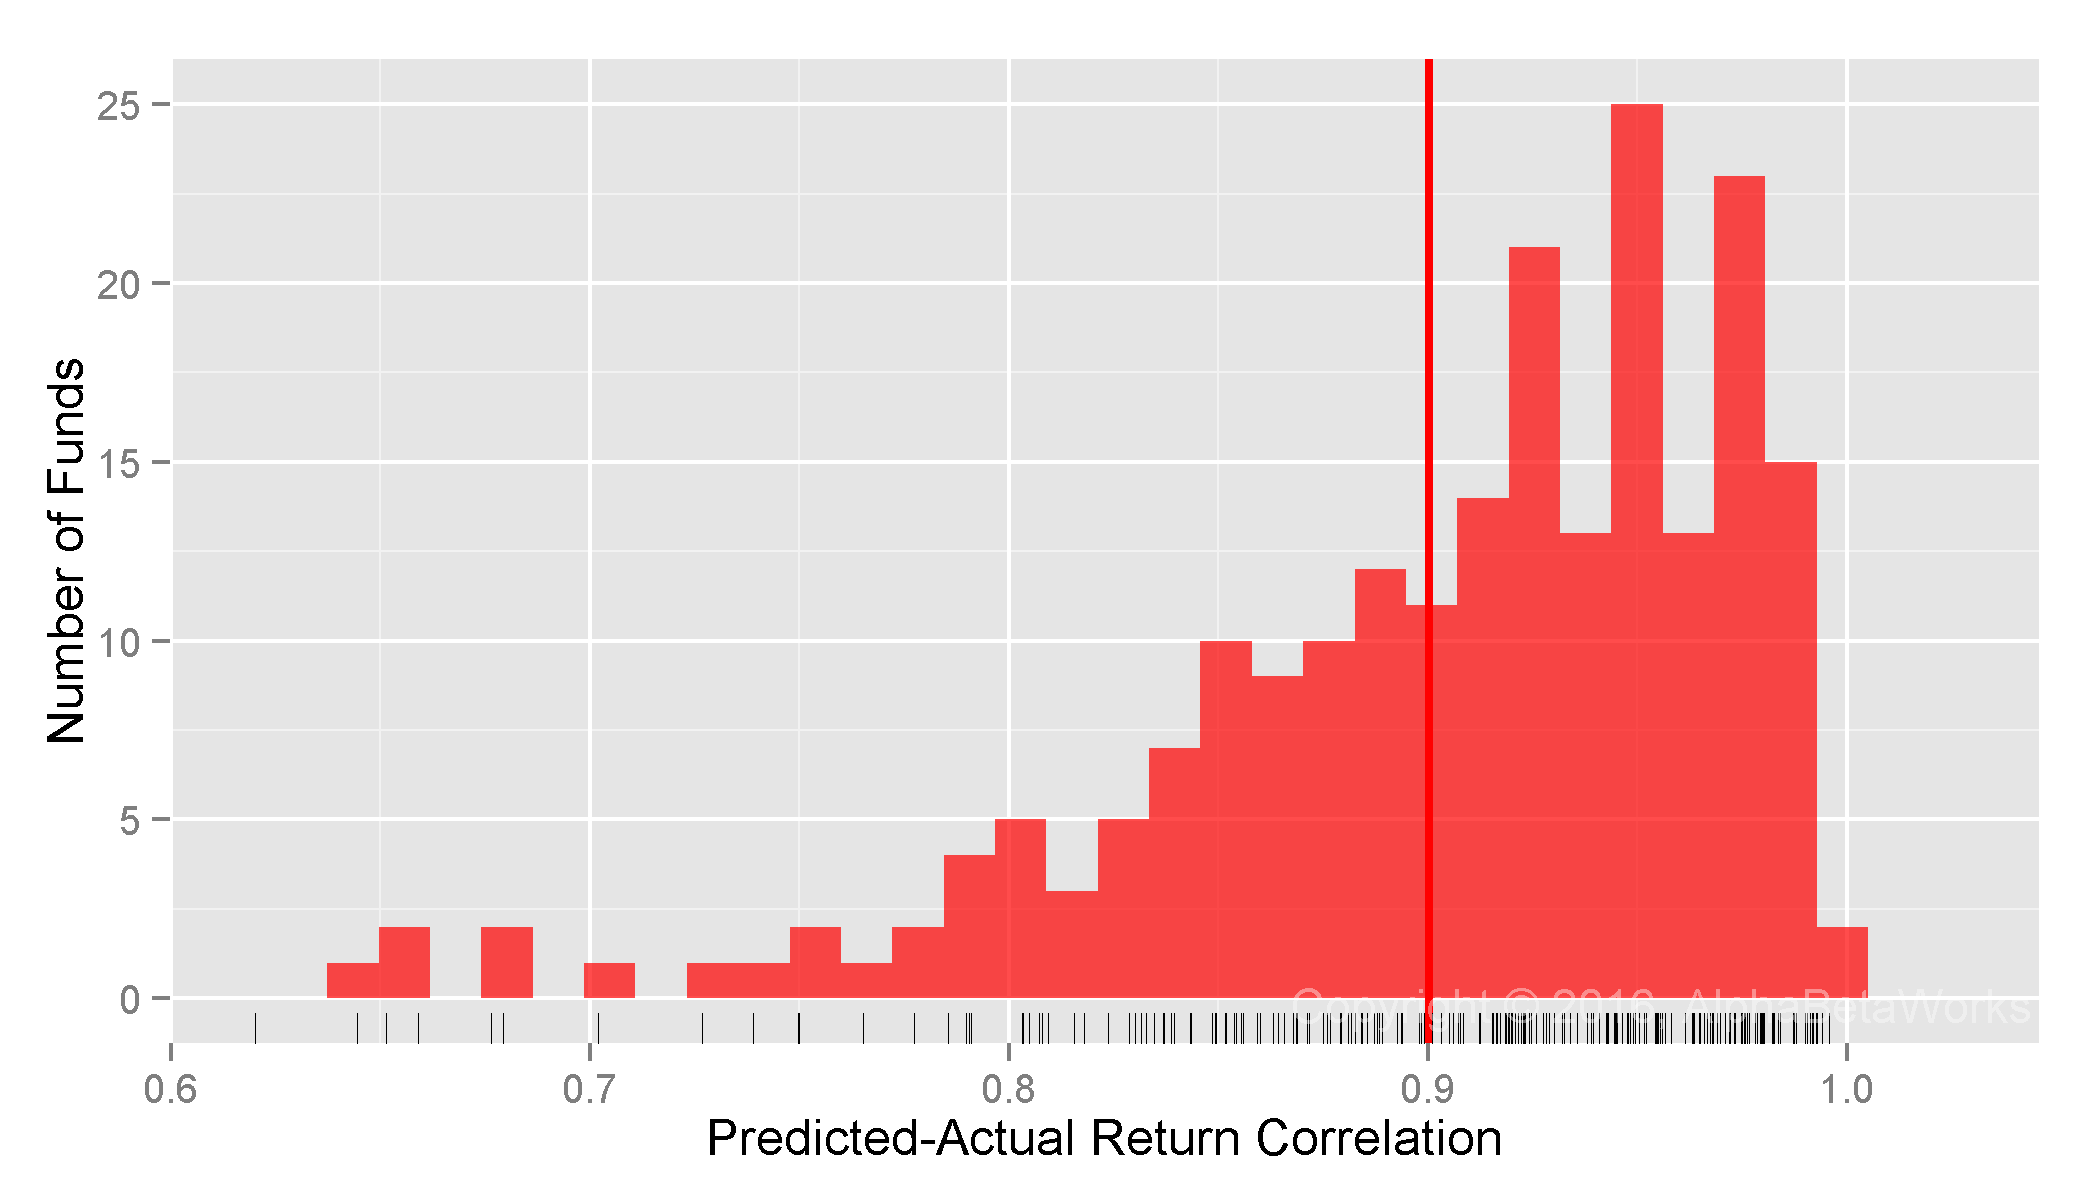
The AlphaBetaWorks Statistical Equity Risk Model continues to produce hedges close to the ideal:
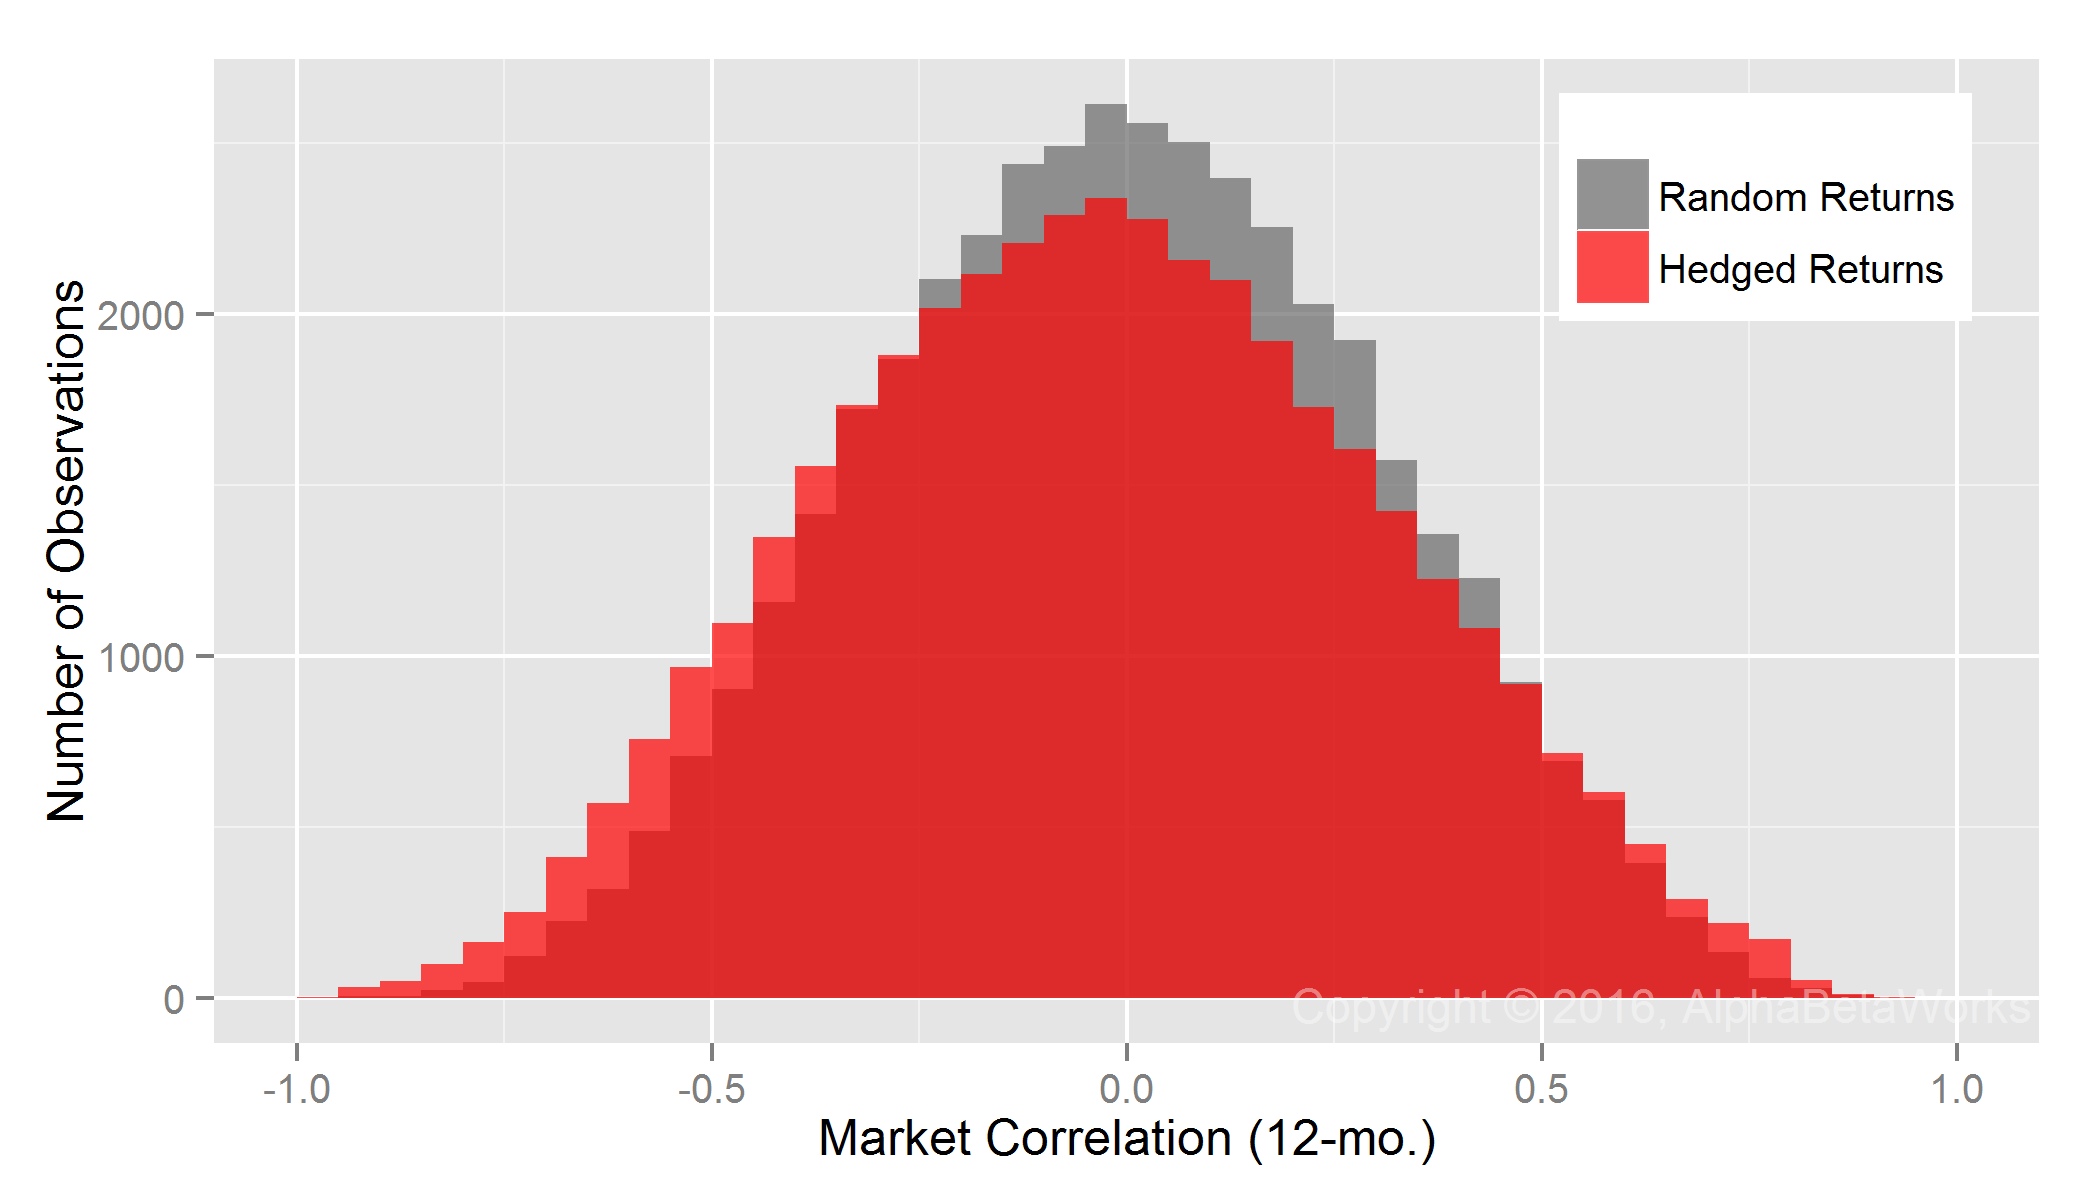
U.S. Long Equity Hedge Fund Portfolios: Realized 12-month market correlations of portfolios hedged using a statistical equity risk model applied to holdings
   Min. 1st Qu.  Median    Mean 3rd Qu.    Max.
-0.9913 -0.2683 -0.0304 -0.0273  0.2085  0.9252
The edge comes from the analysis of individual positions that responds rapidly to portfolio changes and the robust regression methods that are resilient to outliers. The result is superior analysis of individual funds.
Whereas tests using hedge fund long equity portfolios accentuate the flaws of simple hedging and returns-based analysis, the AlphaBetaWorks Statistical Equity Risk Model remains close to the baseline of a perfect hedge. Thus, it is even more vital that portfolio managers and investors who analyze or manage hedge fund equity risk rely on robust models and thoroughly tested methods.
Summary
- Random portfolio returns that would be produced by a perfect hedge are the standard to which equity market hedging techniques can be compared.
- Simplistic hedging that assumes 1 beta for all hedge fund long equity portfolios over-hedges some and under-hedges others, resulting in hedged portfolios with net short and net long realized exposures, respectively.
- Returns-based style analysis (RBSA) is especially dangerous for hedge funds, as it overlooks rapidly changing exposures and fails similarly to the fixed hedge approach.
- Analysis of holdings using a robust and predictive Statistical Equity Risk Model produces close to perfect equity market hedges and is especially critical for managing hedge fund equity risk.