
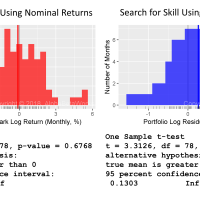
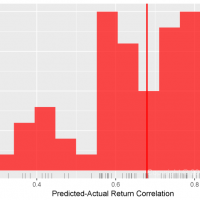
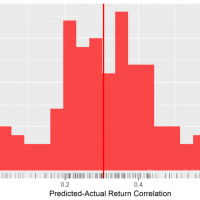
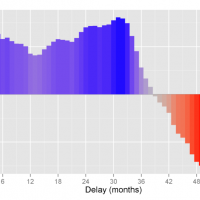
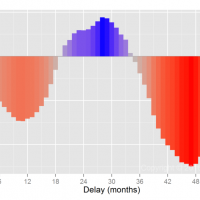
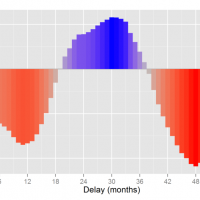
How Much Time is Needed to Detect Evidence of Investment Skill?
What Fraction of International Smart Beta Tracking Error is Dumb Beta?
What Fraction of Smart Beta Tracking Error is Dumb Beta?
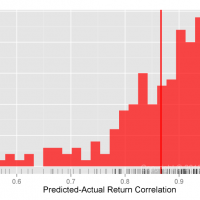
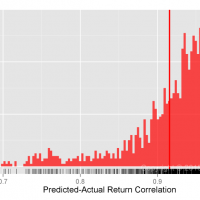
The Predictive Power of Information Ratios
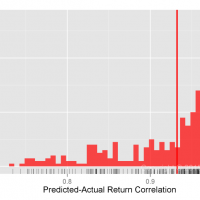
The Predictive Power of Sharpe Ratios
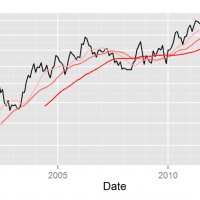
Berkshire Hathaway’s Alpha Decay
There is a good reason many investors consider Berkshire Hathaway the paragon of investment success. For over 20 years, Berkshire’s equity portfolio has outperformed the general market on a risk-adjusted basis. But, in the past two years Berkshire’s alpha has turned negative. We identify the principal culprit and provide evidence of styl[…]
Tests of Equity Market Hedging: U.S. Hedge Funds
Tests of Equity Market Hedging: U.S. Mutual Funds
The Persistence of Negative Investment Performance
Our earlier pieces discussed how nominal investment performance reverts. Since returns are dominated by systematic risk factors (primarily the Market), they are subject to reversal when investment regimes change. In the simplest terms, high risk funds do well in bull markets, and low risk funds do well in bear markets, i[…]
The Decay of Stock Picking Skill
Top Stock Pickers’ Exposure to Valeant
Our recent article established that a portfolio of skilled stock pickers’ ideas generates consistent alpha. This brief analyzes what the AlphaBetaWorks Expert Aggregate had to say about one controversial name, Valeant Pharmaceuticals (VRX). In short, the smart money was in early and left almost a year before Valeant’s recent headaches.
Performance of the Top U.S. St[…]
Testing Equity Risk Models: REIT Portfolios
Systematic Hedge Fund Volatility
Do Equity Risk Models Need a Quality Factor?
Fortunately, most complex factors derive virtually al[…]
Testing Equity Risk Models: Property and Casualty Insurance Portfolios
Testing Global Equity Risk Models
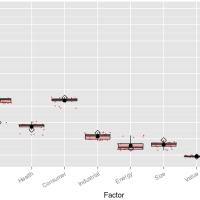
Testing Predictions of Equity Risk Models
Predictive Power of[…]
Hedge Fund Industrials Factor Timing
Hedge Fund Oil Factor Timing
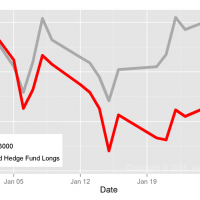
Hedge Fund U.S. Market Timing
At the end of Q1 2015, high market factor exposure (high beta) was the primary source of U.S. hedge funds’ long portfolio crowding. HF Aggregate, a po[…]
Top Energy Hedge Funds’ Trades
Top Energy Hedge Funds
Risk-adjusted return from security selection isolates managers’ stock pickin[…]
Hedge Fund Crowding Toll: January 2015
Hedge Fund Crowding Costs – eHealth
EHTH was not the largest stock-specific hedge fund insurance sector bet[…]
Hedge Fund Crowding Costs – SanDisk
This piece analyzes hedge fund[…]
Hedge Fund Internet Software Crowding
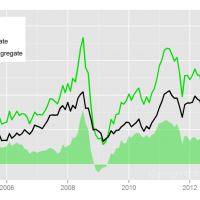
Hedge Fund Internet Software Aggregate
If markets were flat since 2004, the aggregate position-weighted hedge fund internet softwa[…]

Hedge Fund E&P Crowding History
The following video shows the most crowded hedge fund E&P stocks over history, and their historical risk-adjusted performance:
The information he[…]
Hedge Fund Crowding Costs – Energy
Over the past 10 years the aggregate hedge fund long energy portfolio (HF Energy Aggregate) delivered negative risk-adjusted returns.
Since[…]
Pure Sector Factors and the Energy Cycle
In an article introducing pure sector factors, we illustrated how market noise obscures relationships among individual sectors, concealing industry-specific performance. As a result, most investors are oblivious of the underlying secular trends and are frequently blindsided by them. This obliviousness can be costly. For example, investors […]
Vanguard Wellington Fund (VWENX) – Market Timing
Over the past 10 years, the fund returned approximately 7% solely through varying its factor exposures. This compares to an approximately 4% market-timing loss for the average medium turnover U.S. equity mutual fund:
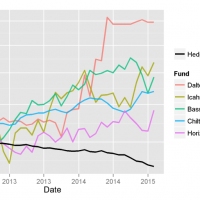
Icahn’s Technology Security Selection
As we discussed in earlier articles, it is a mistake to treat all ideas of excellent managers with equal deference. Even great investors tend to be more skilled in some areas than in others. Carl Icahn is no exception.
Many investors follow the positions of Carl Icahn. His recent open letter to Apple’s CEO Tim Cook will cause some to follow Icahn into […]
Parnassus Core Equity Fund (PRILX) – Returns-Based Analysis
In an earlier article, we discussed the failures of returns-based style analysis – a common method of estimating fund risk:
Returns-based analysis is usually flawed when portfolio risk varies over time.
Returns-based analysis may not even accurately estimate average or representative risk of the portfolio.
Flaws are most pronounced for the most active […]
Berkshire’s Long Equity Position Sizing
Position sizing cost portfolio approximately 10% over the past three years.
Berkshire’s managers appear to have made some of their largest positions things they c[…]
Greenlight Capital’s Energy Equity Security Selection
The following is a chart of the estimated security selection (stock picking) return due […]
Pure Small Cap Performance
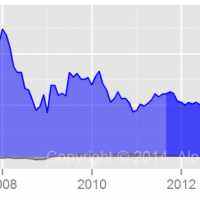
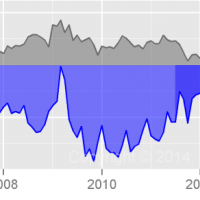
iShares Core High Dividend ETF (HDV) Alpha and Beta
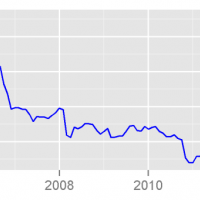
iShares Core High Dividend ETF (HDV) – Historical Beta
U.S. Market exposure (beta) of the fund has varied in the narrow window between 0.52 and 0.60:
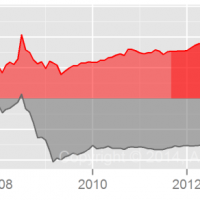
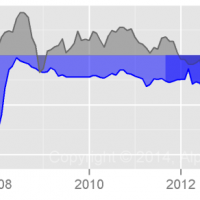
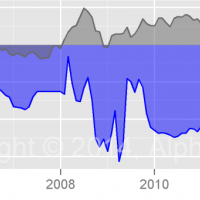
iShares Core High Dividend ETF (HDV) – Historical Alpha
The fund has consistently generated positive risk-adjusted return f[…]
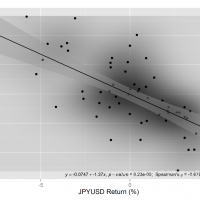
Currency Risk and Local Currency Beta
Reality is rarely this convenient. This standard approach misrepresents the true currency risk of most foreign investments. For example, a[…]
Pershing Square’s Finance Sector Skill
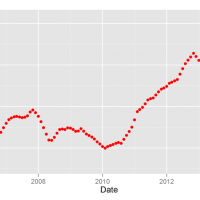
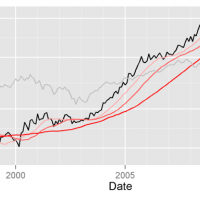
Pershing square has a phenomenal track record of stock picking. Over the past 10 years, it has generated approximately 200% risk-adjusted return from security selection in its long (13F) portfolio. If market were flat for the past 10 years, the portfolio would have gained approximately 200%. We call this risk-adjusted return αReturn:[…]

Greenlight Capital’s Position Sizing
Greenlight’s top positions generally aren’t its best ones. It is common to assume that the top positions of skilled investors are their best ideas, but this is not always the case. If Greenlight sized all positions equally for the past 10 years, the risk adjusted return of long portfolio would have been approximately 20% higher.
We can’t know for sure w[…]
Artisan Funds’ Security Selection
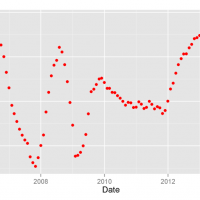
Both Artisan International Fund (ARTIX) and Artisan International Value Fund (ARTKX) show excellent security selection (stock picking) performance over the past 10 years.
If all markets were flat for the past 10 years, ARTIX would have generated approximately 0% cumulative return from stock pic[…]
Paulson’s Energy Sector Skill
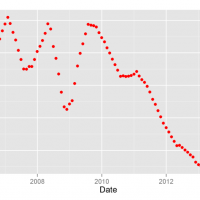
One should be careful when handling Paulson’s energy picks.
A portfolio of Paulson’s long (13F) energy positions has lost ~50% on a risk-adjusted basis. ETFs with the same market and energy sector exposures as the energy portfolio have outperformed it. The historical security selection (stock picking) performance of Paulson’s 13F position[…]
Fisher Asset Management Security Selection
The following is a chart of Fisher Asset Management, LLC’s estimated security selection (stock picking) return for all long positions over the past 10 years:
The analysis evaluated 10 years of 13F fling history for the firm. It estimated the returns the portfolio would have generated if markets were flat – stock picking perf[…]
Oakmark Fund Technology Skill
In general, even fund managers that generate persistently positive active returns are rarely skilled across the board. They have stronger skills or employ stronger analysts in some sectors than in others.
The Oakmark Fund (OARMX) is no different. Over the past 10 years, it generated ~15% from security selection (stock picking):
Over the same […]
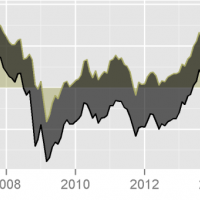
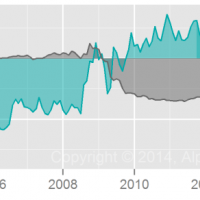
Hedge Fund Passivity
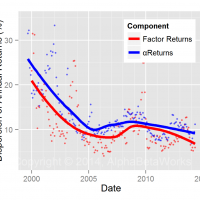
We charted the historical cross sectional standard deviation of factor (systematic) and α (security selection) returns for U.S. hedge funds:
A surprising finding is that, even in midst of the 2008-2009 market volatility spike, the long positions of U.S. hedge funds were less differentiated from each other that they had been in the relatively lowe[…]
Value Partners High Dividend Stocks Fund — Security Selection
The fund generated approximately 3% annual gross return from security selection:
This is the residual return, or αReturn. It is the return in excess of the systema[…]