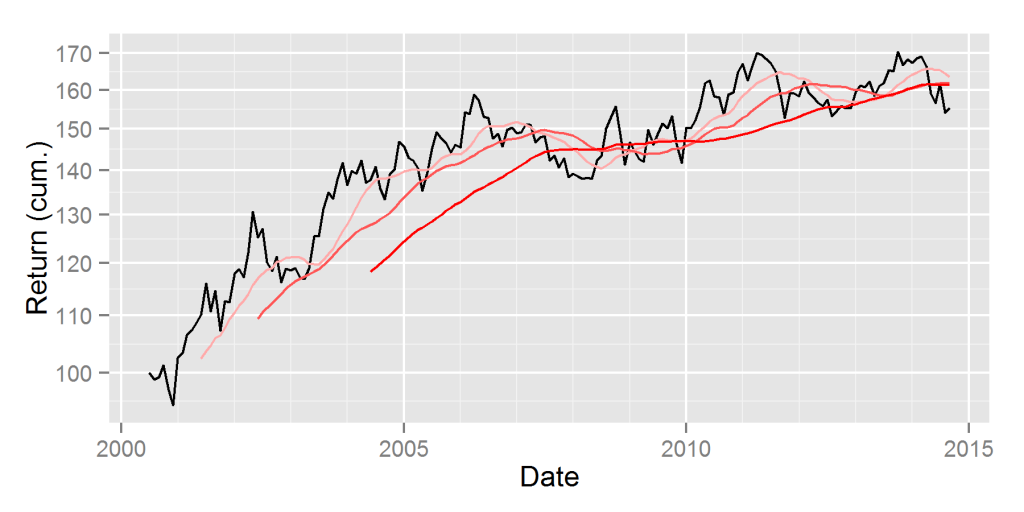
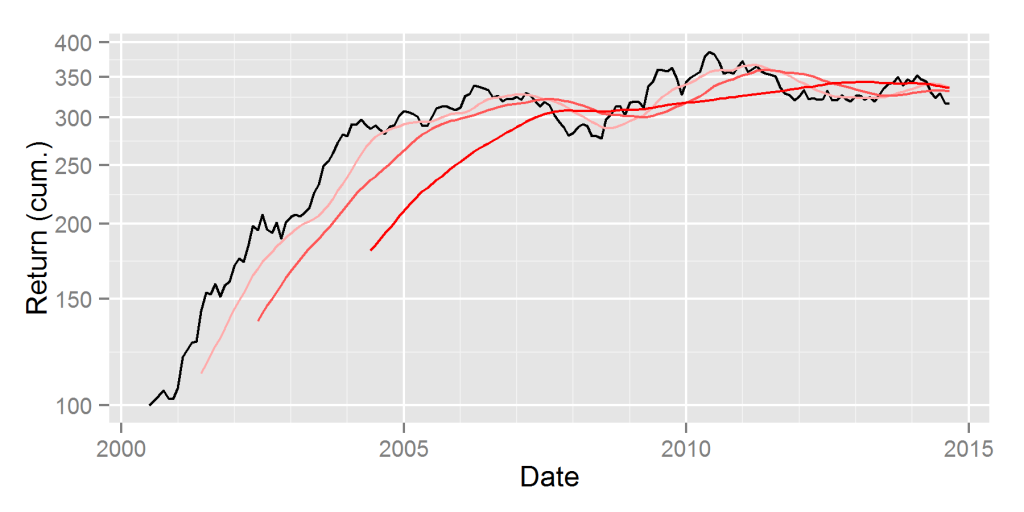
In recent months, the poor performance of small companies has led to a flurry of analysis. Unfortunately, most analysis overlooks small caps’ broad market risk, or beta, and fails to identify pure small cap performance. Consequently, this analysis is imprecise and its conclusions are inaccurate. Much more telling is Size Risk Factor – a pure small cap performance indicator. It reveals that small cap performance has been poor for some time.
Small Cap and Large Cap Index Returns
A common approach to analyzing the relative performance of small caps is comparing a small cap index or ETF to a large cap index or ETF. Performance is compared by plotting price ratios, or relative returns. For instance, the chart below is a comparison of the iShares Russell 2000 ETF (IWM) relative to the SPDR S&P 500 ETF Trust (SPY):
While this is an accurate portrayal of the relative performance of the two ETFs, it does not capture the pure effect of constituents’ sizes. There are a number of differences between the two funds. Size is one of the most significant. The other is market exposure, or market beta.
Small caps tend to have higher beta than large caps: Recent U.S. Market exposure (beta) of IWM is approximately 1.23. It is approximately 0.95 for SPY. Because of this difference in beta, market is often the dominant factor of relative performance. Hence, analyzing trends in small caps requires more than simply looking at a particular index.
The Size Factor – Pure Small Cap Performance
To isolate the pure small cap performance, we must remove the effect of market and sector risks. AlphaBetaWorks’ Size Factor (ABW Size Factor) strips market and sector effects from security returns, revealing performance purely due to size. The ABW Size Factor is the difference in returns, net of market and sector effects, between the largest and the smallest stocks. The opposite of the ABW Size Factor is the ABW Small-Cap Factor.
ABW Size Factor is closely related to the Fama–French SMB Factor, but with enhancements: SMB Factor captures size risk, but it also picks up market and sector returns. ABW Size Factor strips out market and sector effects for a pure size measurement.
With market effect filtered out, the picture looks different. U.S. small caps have been under-performing since 2010. 2014 has been an especially bad year:
On a market-risk-adjusted basis, IWM underperformed by approximately 12% over the 3 year period ending 12/31/2013, even before the steep losses of 2014. Investors aware of the pure small cap performance would not have been surprised by the 2014 returns of small caps.
Unlike the performance of small cap indices, buoyed by their high beta and the advancing market, Size Factor has been flashing warning signs for small cap investors for a few years.


