Tag Archives: hedge fund crowding

Top Stock Pickers’ Exposure to Valeant

In Early – Out Just in Time

Our recent article established that a portfolio of skilled stock pickers’ ideas generates consistent alpha.  This brief analyzes what the AlphaBetaWorks Expert Aggregate had to say about one controversial name, Valeant Pharmaceuticals (VRX).  In short, the smart money was in early and left almost a year before Valeant’s recent headaches.

Performance of the Top U.S. Stock Pickers

Since genuine investment skill persists, top U.S. stock pickers tend to generate persistently positive returns from security selection (idiosyncratic, residual returns). This strong performance derives from the top stock pickers’ individual positions. Their consensus exposures thus cut through the fog of panic and confusion, such as that surrounding VRX.

We track institutional ownership of Valeant by the AlphaBetaWorks Expert Aggregate (ABW Expert Aggregate). The ABW Expert Aggregate is sourced from all institutions that have filed Form 13F.

Nominal returns and related simplistic metrics of investment skill (Sharpe Ratio, Win/Loss Ratio, etc.) are dominated by systematic factors and thus revert. So for an accurate assessment of manager skill, we must eliminate the systematic effects and estimate residual performance due to stock picking. The AlphaBetaWorks Performance Analytics Platform calculates each portfolio’s return from security selection – αReturn. αReturn is the performance a portfolio would have generated if all factor returns had been flat. Each month we identify the five percent of 13F-filers with the most consistently positive αReturns over the prior 36 months. This expert panel of the top stock pickers typically consists of 100-150 firms.

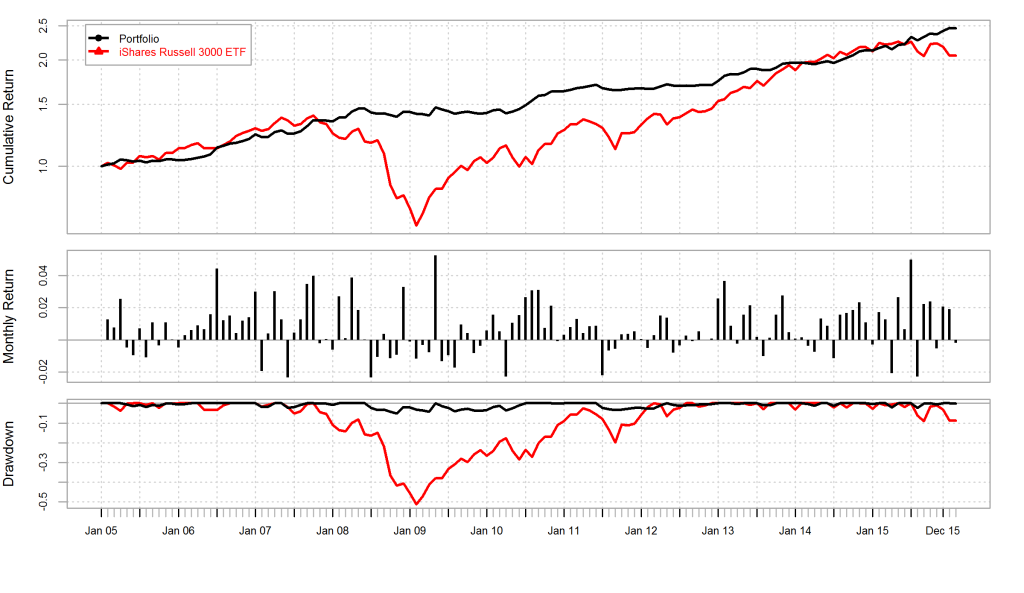
A hedged portfolio that combines the top U.S. stock pickers’ net consensus longs (relative overweights) – lagged 2 months to account for filing delay (the ABW Expert Aggregate) – delivers consistent positive returns as illustrated below:

Chart of the cumulative return of the Market (Russell 3000) and the cumulative return of the hedged portfolio that combines the to 5% U.S. long stock pickers net consensus long (relative overweight) exposures

Cumulative Hedged Portfolio Return: Top U.S. Stock Pickers’ Net Consensus Longs

2005 2006 2007 2008 2009 2010 2011 2012 2013 2014 2015 2016
ABW Expert Aggregate 4.56 14.43 12.74 5.95 -1.25 15.35 2.20 2.24 15.47 8.81 13.16 1.70
iShares Russell 3000 ETF 9.04 15.65 4.57 -37.16 28.21 16.81 0.78 16.43 32.97 12.41 0.34 -5.72
ABW Expert Aggregate iShares Russell 3000 ETF
Annualized Return 8.36 6.40
Annualized Standard Deviation 5.25 15.50
Annualized Sharpe Ratio (Rf=0%) 1.59 0.41

Top Stock Pickers’ Exposure to Valeant Pharmaceuticals (VRX)

The positive idiosyncratic returns of the ABW Expert Aggregate come from its individual positions: Its longs (experts’ relative overweights) tend to generate positive future αReturns. Its shorts (experts’ relative underweights) tend to generate negative future αReturns. The ABW Expert Aggregate thus measures the top stock pickers’ positioning which is predictive of the stocks’ future performance.

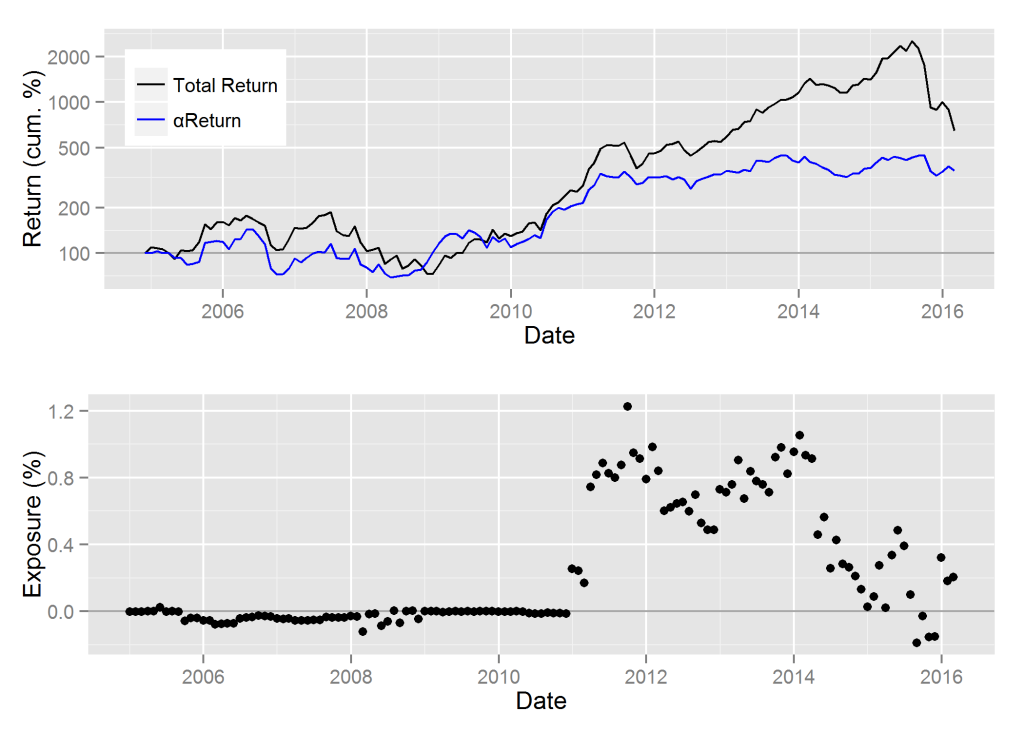
The top panel on the following chart shows the performance of VRX. Nominal returns are in black and cumulative residual returns (αReturns) are in blue. αReturn is the performance VRX would have generated if all systematic factor returns had been flat. The bottom panel shows exposure to VRX within the ABW Expert Aggregate:

Chart of the cumulative αReturn (residual return) of Valeant Pharmaceuticals (VRX) and exposure to VRX within the hedged portfolio that combines the to 5% U.S. long stock pickers net consensus long (relative overweight) exposures

VRX: Cumulative αReturns and Exposure within the ABW Expert Aggregate

Top stock pickers had negligible exposure to VRX until 2011. In early-2011 smart-money exposure to VRX grew rapidly, peaking between 2012 and 2014. Throughout 2014, as the shares appreciated, the top U.S. stock pickers sharply cut their exposure to VRX.

The panic hit a year after the top stock pickers dramatically cut their exposure. By 2015 smart-money exposure to VRX was a mixed signal as it tracked the stock’s volatility. Ironically, this is when VRX became one of the most crowded hedge fund bets. Though VRX had a history of smart-money ownership, this vote of confidence was withdrawn by 2015. Future stock-specific returns to VRX, as predicted by the ABW Expert Aggregate, increased rapidly in 2011 and dropped rapidly by 2015.

Investors, allocators, and fund-followers, armed with our analytics, would have taken note. Those looking for the smart money to back their long or short views of VRX must now look elsewhere.

Conclusions

  • Top stock pickers’ ownership is predictive of future stock performance, since their net consensus longs (relative overweights) tend to generate positive future αReturns and net consensus shorts (relative underweights) tend to generate negative future αReturns.
  • Valeant Pharmaceuticals (VRX) was a large overweight of the top stock pickers between 2011 and 2014, but these positions were mostly liquidated by 2015.
  • Top stock pickers’ current ownership of VRX is not a predictive indicator, but their rapid liquidation in 2014 was a visible warning.
The information herein is not represented or warranted to be accurate, correct, complete or timely.
Past performance is no guarantee of future results.
Copyright © 2012-2016, AlphaBetaWorks, a division of Alpha Beta Analytics, LLC. All rights reserved.
Content may not be republished without express written consent.
U.S. Patents Pending.

Systematic Hedge Fund Volatility

Hedge fund replication, tracking, and analysis often focus on the individual positions and on the stock-specific risk they contribute. This overlooks the far more important return source – systematic hedge fund volatility. A statistical equity risk model that robustly captures exposures to the key systematic risk factors delivers 0.92 (92%) correlation between predicted and actual returns for most hedge fund long equity portfolios reported in regulatory filings. It follows that risk, performance, and crowding of these portfolios are overwhelmingly systematic. These systematic returns can be replicated and hedged with models built on investable factors and with passive investments that track these factors. Fixation on individual holdings and position overlap is misguided at best and dangerous at worst.

U.S. Hedge Fund Equity Portfolio Sample

Our analysis covers approximately 300 U.S. hedge fund long equity portfolios active over the past 15 years. We started with the universe of over 1,000 funds. First, we eliminated half that were not analyzable from regulatory filings (primarily because of high turnover). We then eliminated the portfolios that had less than five years of contiguous history or fewer than five equity positions during a period.

Our conclusions apply to most hedge fund long equity portfolios, though high turnover funds will require higher frequency of position data for predictive return forecasts. By extension, these findings also apply to long-biased hedge funds that derive most of their performance from their long portfolios. They apply to short books as well: our experience shows that short hedge fund books tend to be even more diversified and hence even more governed by their systematic exposures (possibly due to managers’ sensitivity to stock-specific risk). Finally, systematic volatility is even higher for funds of hedge funds due to their higher diversification.

Testing the Predictive Power of Equity Risk Models for Hedge Funds

To quantify the share of systematic hedge fund volatility, we need to test the ability of an equity risk model to predict future hedge fund returns. We followed the approach of our earlier studies of equity risk models’ predictive power:

  • Calculated factor exposures from the estimated holdings at the end of each month and the holdings’ factor exposures;
  • Predicted the following month’s returns using these ex-ante factor exposures and ex-post factor returns;
  • Compared returns predicted by past factor exposures to subsequent portfolio performance and evaluated the predictive accuracy of a model.

The correlation between predicted and actual returns measures a model’s accuracy and determines the fraction of systematic hedge fund volatility as defined by the model. The higher the correlation, the more effective a model is at hedging, stress testing, replication, and evaluating investment skill.

Systematic Hedge Fund Volatility within a Single-Factor Statistical Equity Risk Model

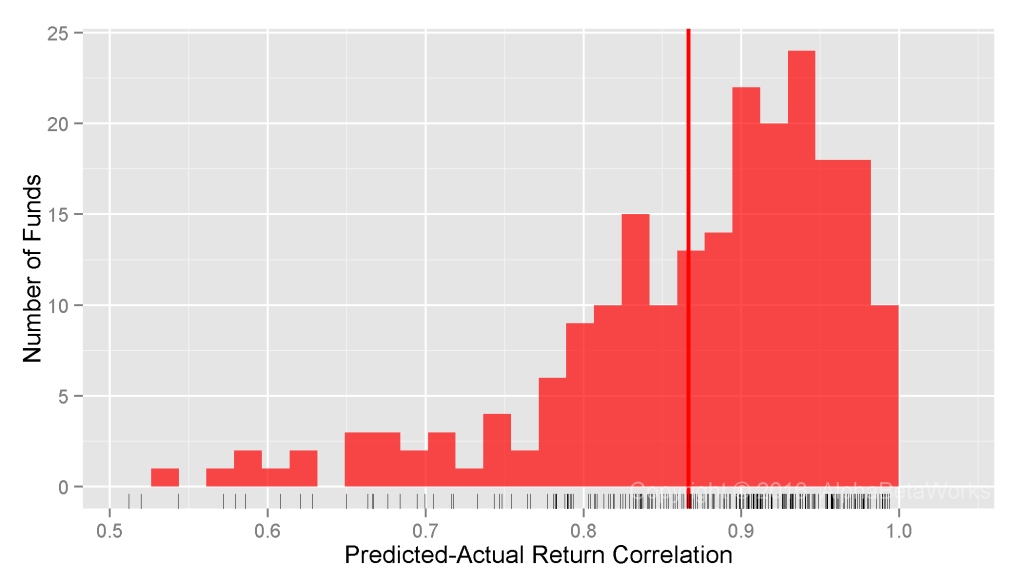
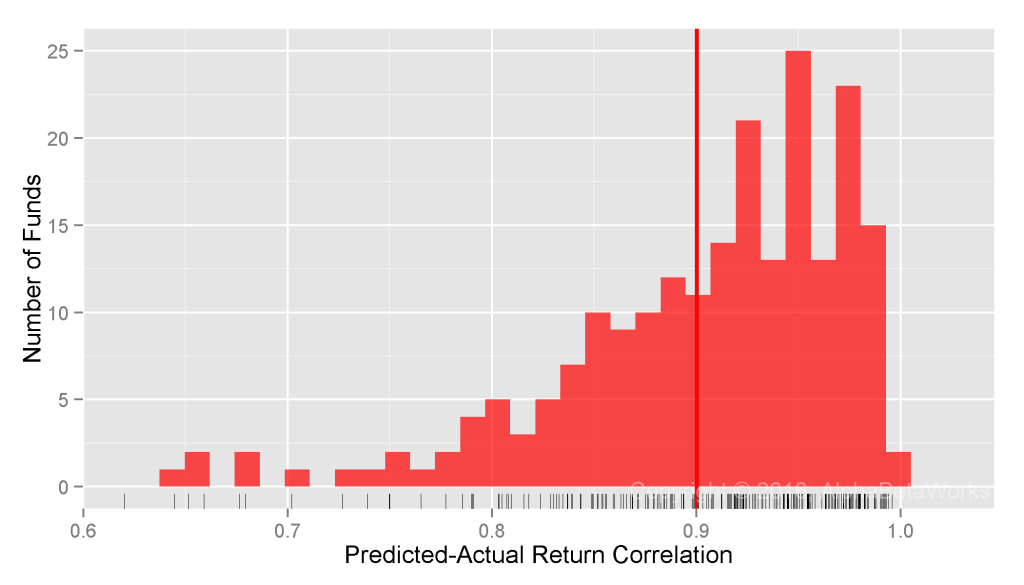
The simplest statistical equity risk model uses a single systematic risk factor – Market Beta. Since Market Beta is the dominant risk factor, even a simple model built with robust statistical methods delivers 0.87 mean and 0.90 median correlations between predicted and actual monthly returns:

Chart of the correlations between predicted returns constructed using a single-factor statistical equity risk model and actual historical returns for the equity portfolios of over 300 U.S. Hedge Fund Long Equity Portfolios

U.S. Hedge Fund Long Equity Portfolios: Correlation between a single-factor statistical equity risk model’s predictions and actual monthly returns

  Min. 1st Qu.  Median    Mean 3rd Qu.    Max. 
0.2924  0.8251  0.8978  0.8665  0.9420  0.9938

Within this model, 81% of hedge fund variance is systematic.

Systematic Hedge Fund Volatility within a Two-Factor Statistical Equity Risk Model

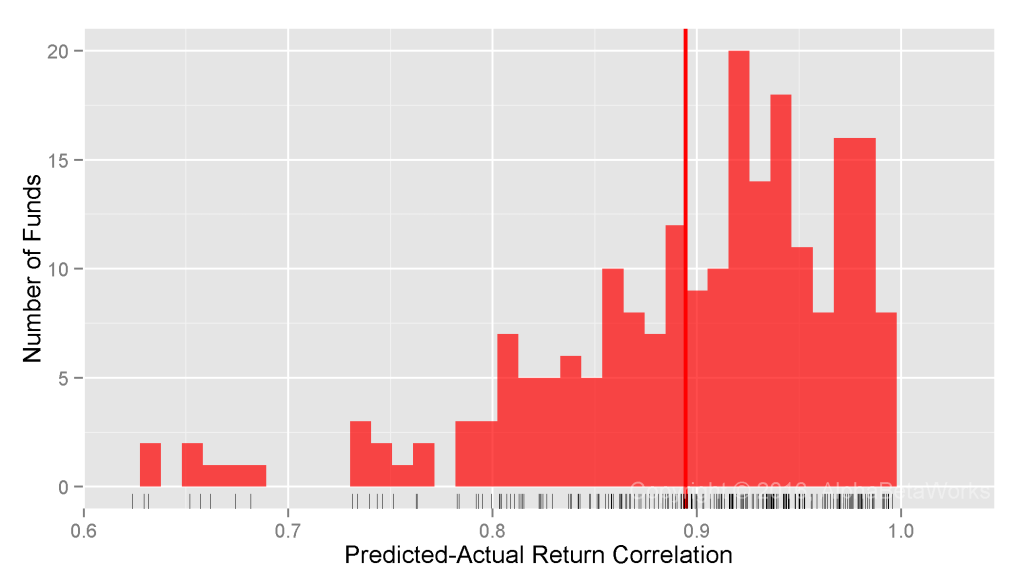
A two-factor model that adds Sector Risk Factors, estimated with robust methods, delivers 0.89 mean and 0.92 median correlations between predicted and actual monthly returns:

Chart of the correlations between predicted returns constructed using a two-factor statistical equity risk model and actual historical returns for the equity portfolios of over 300 U.S. Hedge Fund Long Equity Portfolios

U.S. Hedge Fund Long Equity Portfolios: Correlation between a two-factor statistical equity risk model’s predictions and actual monthly returns

  Min. 1st Qu.  Median    Mean 3rd Qu.    Max. 
0.5843  0.8584  0.9159  0.8946  0.9502  0.9957

Systematic Hedge Fund Volatility within a Multi-Factor Statistical Equity Risk Model

The standard AlphaBetaWorks U.S. Equity Statistical Risk Model extends the two-factor model with Style Factors (Value/Growth and Size) and Macroeconomic Factors (Bonds, Oil, Currency, etc.). This expanded model delivers 0.90 mean and 0.92 median correlations between predicted and actual monthly returns for U.S. hedge fund long equity portfolios:

Chart of the correlations between predicted returns constructed using a multi-factor statistical equity risk model and actual historical returns for the equity portfolios of over 300 U.S. Hedge Fund Long Equity Portfolios

U.S. Hedge Fund Long Equity Portfolios: Correlation between a multi-factor statistical equity risk model’s predictions and actual monthly returns

  Min. 1st Qu.  Median    Mean 3rd Qu.    Max. 
0.5055  0.8646  0.9204  0.9003  0.9554  0.9957

For the 25% of hedge fund portfolios it handles the worst, the model still achieves 0.51-0.86 correlation between predicted monthly returns and realized monthly returns.

Many of the outliers with low correlations hold substantial fixed income, exotic, and hybrid positions. To provide the most conservative assessment of the model’s predictive accuracy and the proportion of systematic risk, we did not alter the universe to exclude these outliers.

Unsurprisingly, given hedge funds’ aggressiveness, the model is less predictive for hedge funds than they are for mutual funds and insurance companies. Still, 85% of monthly return variance of most hedge fund long equity portfolios is systematic. And over 80% of that is due to a single factor. In other words, investors could replicate over 80% of this variance simply by replicating the hedge funds’ Market exposure.

Amazingly, much of the popular analysis of hedge fund risk and crowding ignores systemic factors and focuses solely on individual positions. This simplistic approach, even in the rare cases where it is done correctly, addresses only 15% of the risk that is residual, idiosyncratic, or stock-specific. Investors who rely on these simplistic approaches will make a variety of mistakes. For instance, they might wrongly conclude that two funds are differentiated because they have no positions in common. Yet, these two funds can have similar systematic factor exposures and thus high correlation; market hiccups will be magnified.

Conclusions

  • For most U.S. hedge fund long equity portfolios estimated from regulatory filings, a robust statistical equity risk model delivers over 0.92 correlation between predicted monthly returns and realized monthly returns.
  • 85% of the monthly return variance of hedge fund long equity portfolios is systematic, hence not attributable to individual stock bets.
  • Fixation on hedge funds’ stock-specific bets and crowding is misguided and dangerous, since this risk accounts for at most 15% of the portfolio variance for most hedge funds.
  • Investors who rely on simplistic approaches to hedge fund risk analysis may make a variety of mistakes, including missed crowding due to shared systematic factor exposures.
The information herein is not represented or warranted to be accurate, correct, complete or timely.
Past performance is no guarantee of future results.
Copyright © 2012-2016, AlphaBetaWorks, a division of Alpha Beta Analytics, LLC. All rights reserved.
Content may not be republished without express written consent.

Hedge Fund Industrials Factor Timing

In an earlier post, we discussed the largest bets hedge fund long portfolios were making in Q1 2015. The third largest was on the Industrials Factor. This is the risk specific to the industrials sector after controlling for market exposure. It captures capital allocation to industrials and sensitivity (beta) to the sector. There is weak statistical evidence of poor industrials factor timing by hedge funds – investors who follow hedge funds should either ignore this bet or treat it as a negative indicator.

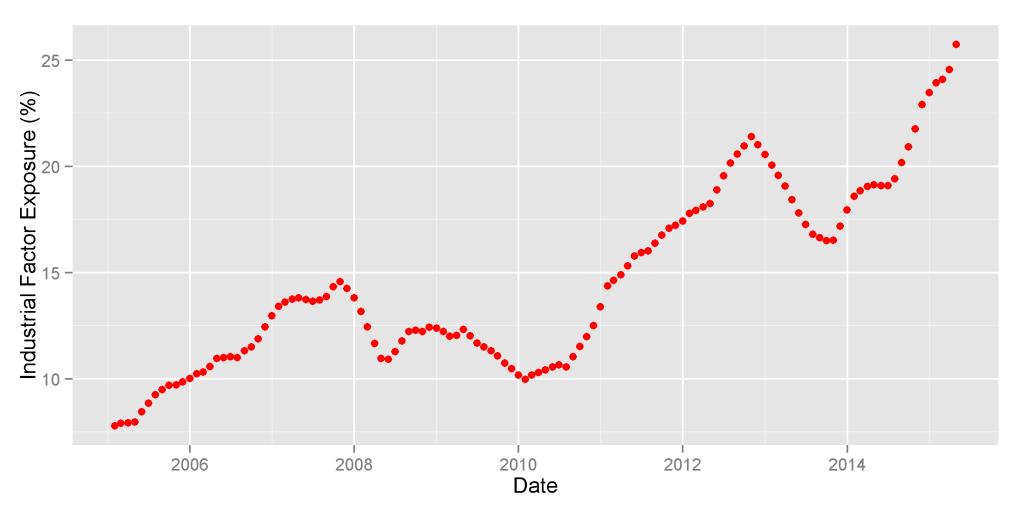
At the end of Q1 2015, high industrials sector factor exposure was the third largest source of U.S. hedge funds’ long portfolio crowding. HF Aggregate, a portfolio consisting of popular long U.S. equity holdings of all hedge funds tractable from quarterly filings, had over 25% industrials factor exposure – a 9% overweight relative to Market. This exposure was at an all-time high:

Chart of the historical industrials factor exposure of U.S. Hedge Fund Aggregate

U.S. Hedge Fund Aggregate’s Industrials Sector Factor Exposure History

This industrials factor exposure captures sector risk after controlling for market exposure. For example, a fund with 10% allocated to a broad industrials index will have approximately 10% industrials factor exposure. A fund with 10% allocated to a 2x-levered broad industrials ETF will have approximately 20% industrials factor exposure.

Here we analyze the hedge fund industry’s skill in timing the U.S. Industrials Factor by varying this exposure. The AlphaBetaWorks Performance Analytics Platform evaluates market timing skills and performance using two related tests:

  • Statistical test for the relationship between factor exposure and subsequent factor returns,
  • Statistical test for the size and consistency of returns generated by varying factor exposures.

Hedge Fund Industrials Factor Exposure and Industrials Factor Return

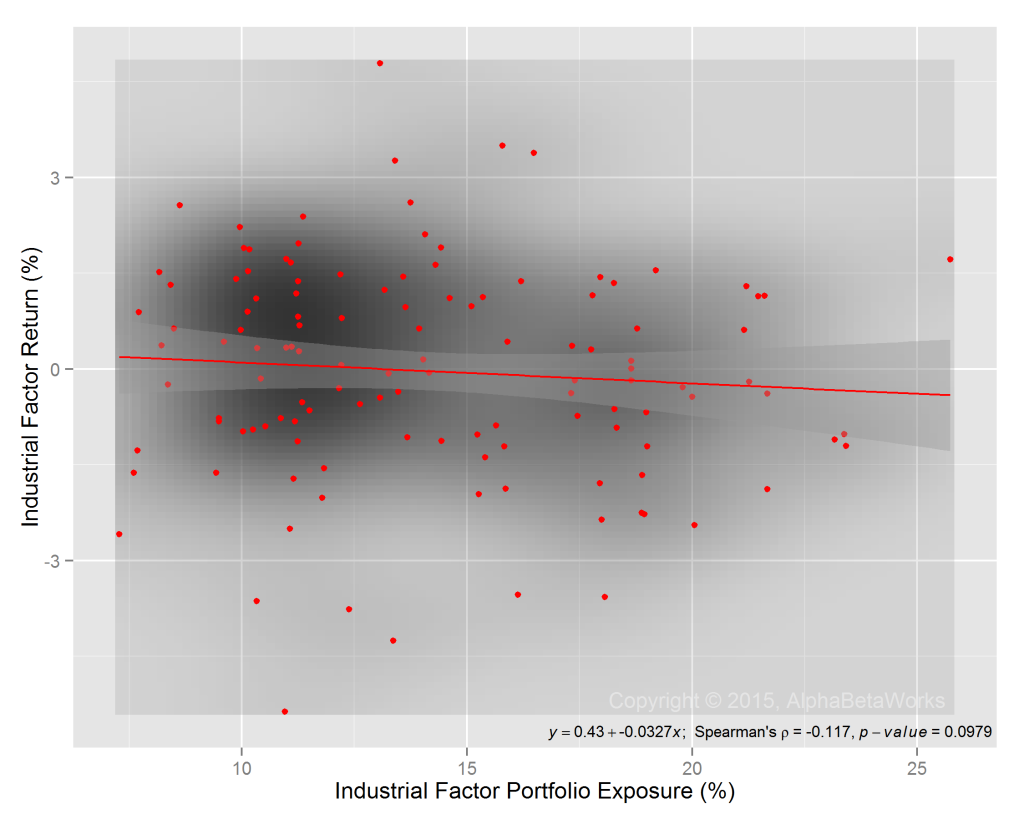
We calculated the Spearman’s rank correlation coefficient of HF Aggregate’s industrials factor exposure and subsequent industrials factor return for the past 10 years and tested it for significance. The chart below illustrates the correlation between the two series and the test results:

Chart of the correlation between historical industrials factor exposure of U.S. Hedge Fund Aggregate and subsequent factor return

U.S. Hedge Fund Aggregate’s Industrials Factor Exposure and Return

There is a statistically weak negative relationship between HF Aggregate’s industrials factor exposure and subsequent factor performance. Hedge fund industrials factor exposure is a weak predictor of future industrials returns.

Hedge Fund Industrials Factor Timing Returns

Over the past 10 years, HF Aggregate (USHFS in red) made approximately 0.9% less than it would have with constant industrials factor exposure, as illustrated below. The performance of HF Aggregate is compared to all tractable 13F filers (Group in gray). The AlphaBetaWorks Performance Analytics Platform identifies this performance due to industrials factor timing as industrials βReturn:

Chart of the cumulative historical contribution of variation in industrials factor exposure of U.S. Hedge Fund Aggregate to the Aggregate’s performance

U.S. Hedge Fund Aggregate’s Industrials Factor Timing Return

The weak evidence of poor industrials factor timing by the industry, combined with the high recent industrials factor exposure, is a weak bearish indicator for the sector.

Summary

  • The industrials factor exposure of U.S. hedge funds’ long portfolios is weakly predictive of subsequent sector performance.
  • Current hedge fund industrials factor exposure, at 10-year highs, is a weak bearish indicator for the Industrials Sector.
  • Investors who track hedge fund holdings should either ignore this bet or treat is as a negative indicator.
The information herein is not represented or warranted to be accurate, correct, complete or timely.
Past performance is no guarantee of future results.
Copyright © 2012-2015, AlphaBetaWorks, a division of Alpha Beta Analytics, LLC. All rights reserved.
Content may not be republished without express written consent.

Hedge Fund Oil Factor Timing

In an earlier post, we discussed the largest bets hedge fund long portfolios were making in Q1 2015. The second largest was on the oil price. This exposure is the residual oil price risk after controlling for market and sector exposures. It captures overweighting within various sectors of companies that out- or underperform under rising oil price. There is weak statistical evidence of skilled oil factor timing by hedge funds – the current bet is a weak bullish indicator for oil prices.

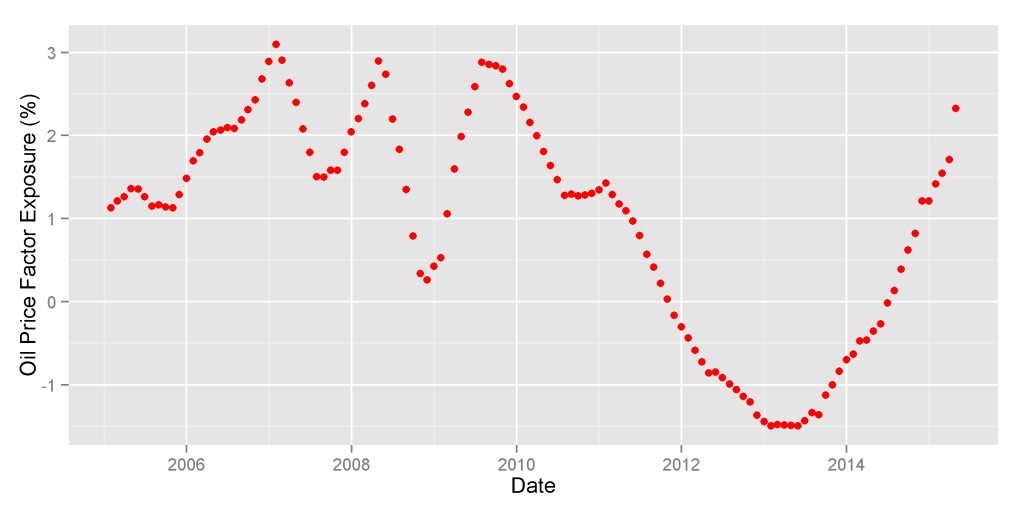
At the end of Q1 2015, high oil price factor exposure was the second largest source of U.S. hedge funds’ long portfolio crowding. HF Aggregate, a portfolio consisting of popular long U.S. equity holdings of all hedge funds tractable from quarterly filings, had approximately 2.5% oil price factor exposure. This exposure was approaching the 10-year highs reached in 2007-2009:

Chart of the exposure of oil price factor of the U.S. Hedge Fund Aggregate

U.S. Hedge Fund Aggregate’s Oil Factor Exposure History

This oil price exposure captures residual oil risk after controlling for sector exposures. For examples, airlines with higher operational or financial leverage than peers have negative oil price factor exposure – they will underperform peers when oil price increases; airlines with lower operational or financial leverage than peers have positive oil price factor exposure –they will outperform peers when oil price increases.

Here we analyze the hedge fund industry’s skill in timing the oil price by varying this intra-sector oil price risk. The AlphaBetaWorks Performance Analytics Platform evaluates market timing skills and performance using two related tests:

  • Statistical test for the relationship between factor exposure and subsequent factor returns,
  • Statistical test for the size and consistency of returns generated by varying factor exposures.

Hedge Fund Oil Factor Exposure and Oil Return

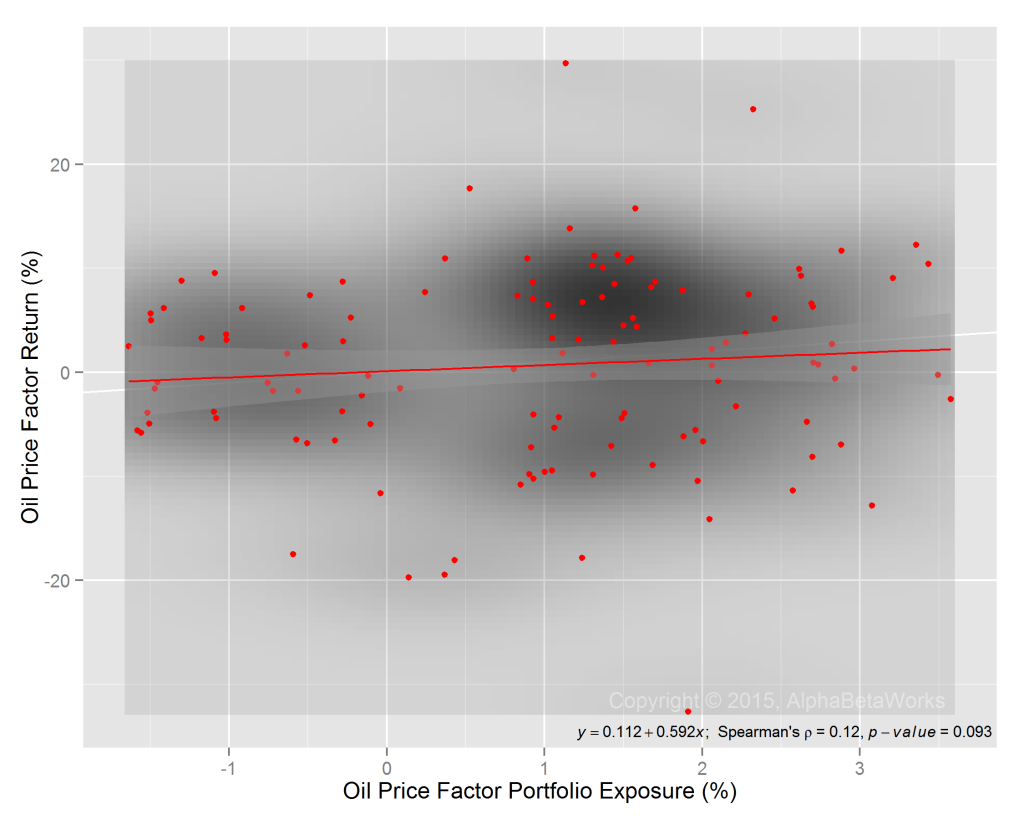
We calculated the Spearman’s rank correlation coefficient of HF Aggregate’s oil price factor exposure and subsequent oil price return and tested it for significance. The chart below illustrates the correlation between the two series and the test results:

Chart of the correlation between oil price factor exposure of the U.S. Hedge Fund Aggregate and subsequent oil price return

U.S. Hedge Fund Aggregate’s Oil Factor Exposure and Return

There is a statistically weak positive relationship between HF Aggregate’s oil factor exposure and subsequent oil performance. Hedge fund oil factor exposure is a weak indicator of future oil price direction.

Hedge Fund Oil Factor Timing Returns

Over the past 10 years, HF Aggregate (USHFS in red) made approximately 1.5% more than it would have with constant oil factor exposure, as illustrated below. The performance of HF Aggregate is compared to all tractable 13F filers (Group in gray). The AlphaBetaWorks Performance Analytics Platform identifies this performance due to oil price factor timing as oil price βReturn:

Chart of the return due to variation in oil price factor exposure of the U.S. Hedge Fund Aggregate

U.S. Hedge Fund Aggregate’s Oil Factor Timing Return

The weak evidence of oil factor timing skill by the industry, combined with the high recent oil factor exposure, is a weak bullish indicator for oil prices.

Summary

  • The oil price factor exposure of U.S. hedge funds’ long portfolios is weakly predictive of subsequent oil performance.
  • Current hedge fund oil factor exposure, near 10-year highs, is a weak bullish indicator for oil prices.
The information herein is not represented or warranted to be accurate, correct, complete or timely.
Past performance is no guarantee of future results.
Copyright © 2012-2015, AlphaBetaWorks, a division of Alpha Beta Analytics, LLC. All rights reserved.
Content may not be republished without express written consent.

Hedge Fund U.S. Market Timing

The single largest bet hedge fund long portfolios were making in Q1 2015 was on the U.S. market (high beta). While the bet is exceptionally large, it is not predictive of market direction. Allocators should pay attention to this risk aggregation.

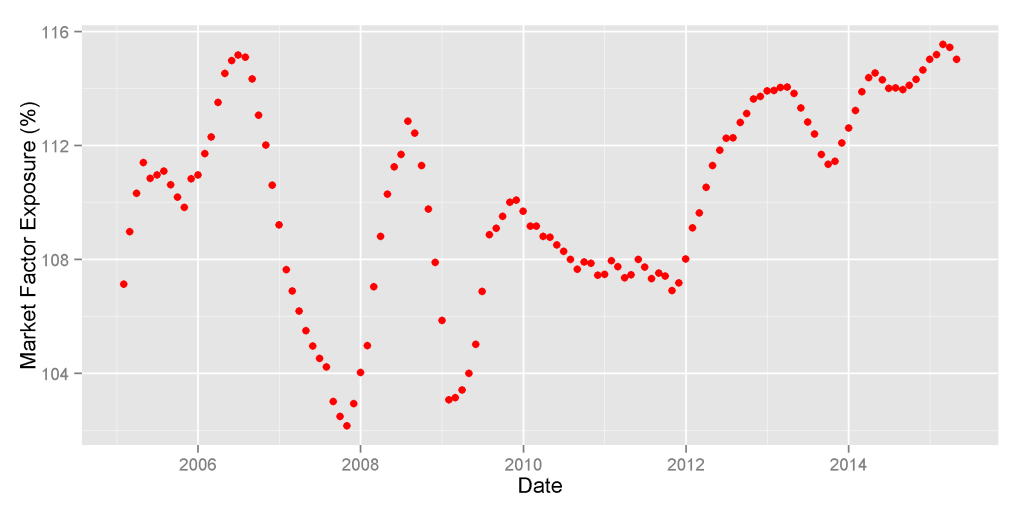
At the end of Q1 2015, high market factor exposure (high beta) was the primary source of U.S. hedge funds’ long portfolio crowding. HF Aggregate, a portfolio consisting of popular long U.S. equity holdings of all hedge funds tractable from quarterly filings, had approximately 115% U.S. market factor exposure (1.15 U.S. market beta). This exposure was at 10-year highs – the level last seen in mid-2006:

Chart of the historical U.S. Market Factor exposure of U.S. Hedge Fund Aggregate

U.S. Hedge Fund Aggregate’s U.S. Market Factor Exposure History

Our work on hedge fund crowding has so far not addressed hedge fund factor timing and hedge fund U.S. market timing specifically. We dive into this performance here.

The AlphaBetaWorks Performance Analytics Platform evaluates market timing skills and performance using two related tests:

  • Statistical test for the relationship between factor exposure and subsequent factor returns,
  • Statistical test for the size and consistency of returns generated by varying factor exposures.

Hedge Fund Market Exposure and Market Return

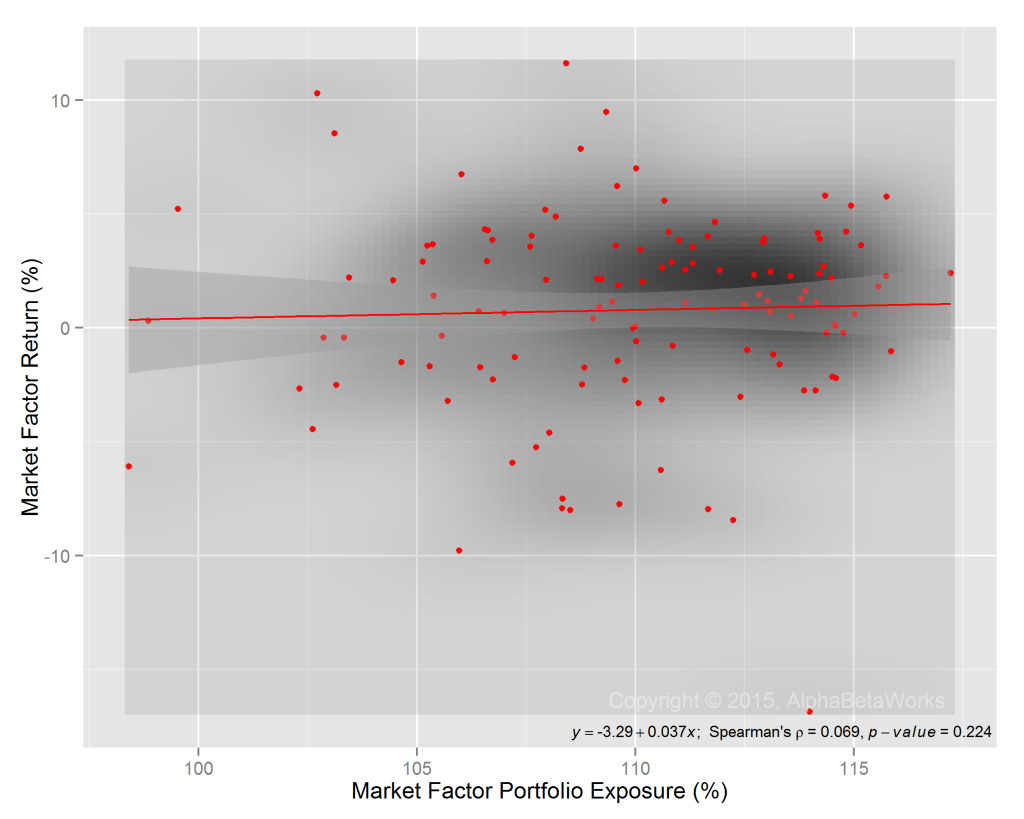
We calculated the Spearman’s rank correlation coefficient of HF Aggregate’s market exposure and subsequent market return and tested it for significance. The chart below illustrates the correlation between the two series and the test results:

Chart of the correlation between the U.S. market exposure of long U.S. hedge fund equity portfolios and U.S. market return

U.S. Hedge Fund Aggregate’s U.S. Market Exposure and Return

The chart shows that there is a positive relationship between HF Aggregate’s U.S. market exposure and subsequent U.S. market return, but it is weak and statistically insignificant. In other words, hedge funds’ variation in U.S. market exposure has done little to help their performance.

Hedge Fund U.S. Market Timing Returns

Over the past 10 years, HF Aggregate (USHFS in red) made approximately 1% more than it would have with constant factor exposures, as illustrated below. The performance of HF Aggregate is compared to all tractable 13F filers (Group in gray). The AlphaBetaWorks Performance Analytics Platform identifies this performance due to U.S. market factor timing as U.S. market βReturn:

Chart of the historical return due to variation in U.S. market exposure of long U.S. hedge fund equity portfolios

U.S. Hedge Fund Aggregate’s U.S. Market Timing Return

The performance impact of this variation in beta within U.S. hedge fund long portfolios is also minor. However, the group of all 13F filers was a poor market timer, particularly during the volatility of 2008-2009. During the crisis, non-filers were the smart money and took advantage of U.S. market volatility, at the expense of 13F filers. 13F filers were a contrarian indicator.

Summary

  • Hedge fund long equity portfolios consistently take 5-15% more market risk than S&P500 and other broad market benchmarks.
  • There has been no statistically significant relationship between U.S. market exposure (market beta) of U.S. hedge funds’ long portfolios and subsequent market return.
  • The high market factor exposure of U.S. hedge funds’ long portfolios is not predictive of subsequent market returns.
  • The broader group of all 13F filers generated significant negative returns by varying market exposure, particularly during the 2008-2009 volatility.
The information herein is not represented or warranted to be accurate, correct, complete or timely.
Past performance is no guarantee of future results.
Copyright © 2012-2015, AlphaBetaWorks, a division of Alpha Beta Analytics, LLC. All rights reserved.
Content may not be republished without express written consent.


Top Energy Hedge Funds’ Trades

Energy investments have struggled in recent months. Crowded hedge fund energy bets have done especially poorly. In this piece, we explore the overall hedge fund energy performance and the results of the top stock pickers in the Oil and Gas Production, Integrated Oil, and Oilfield Services Sectors.

Top Energy Hedge Funds

Risk-adjusted return from security selection isolates managers’ stock picking performance and identifies skill. AlphaBetaWorks defines αReturn as a metric of security selection performance – the estimated annual percentage return a fund would have generated in a flat market. This is also the outperformance relative to a passive portfolio with the same market (factor, systematic) risk.

The hedge fund industry has a poor record in the Energy Sector. Over the past 10 years, investors would have made approximately 20% more holding an ETF portfolio with similar market (factor) risk. If markets had been flat for the past 10 years, the average hedge fund long energy portfolio would have declined by approximately 20%.

Over the past three years, the peer group of all medium turnover hedge funds lost approximately 12% picking long energy stocks. On average, if the funds had simply invested in a portfolio of ETFs with the same risk, they would have made 12% more on their energy book. Half of these losses came in 2014:

Jan Feb Mar Apr May Jun Jul Aug Sep Oct Nov Dec Year
2012 -1.08 -0.29 -0.14 0.48 -0.15 -0.28 -0.54 -0.16 0.44 0.10 -0.08 -0.38 -2.06
2013 -0.63 0.12 0.35 -0.74 -0.33 -0.75 0.14 -0.45 -0.32 -0.58 -0.26 0.18 -3.22
2014 0.54 -0.89 -0.23 0.64 -0.90 -0.35 -0.74 -0.01 -1.34 -1.58 -0.45 -1.42 -6.55
2015 -0.77 -0.77

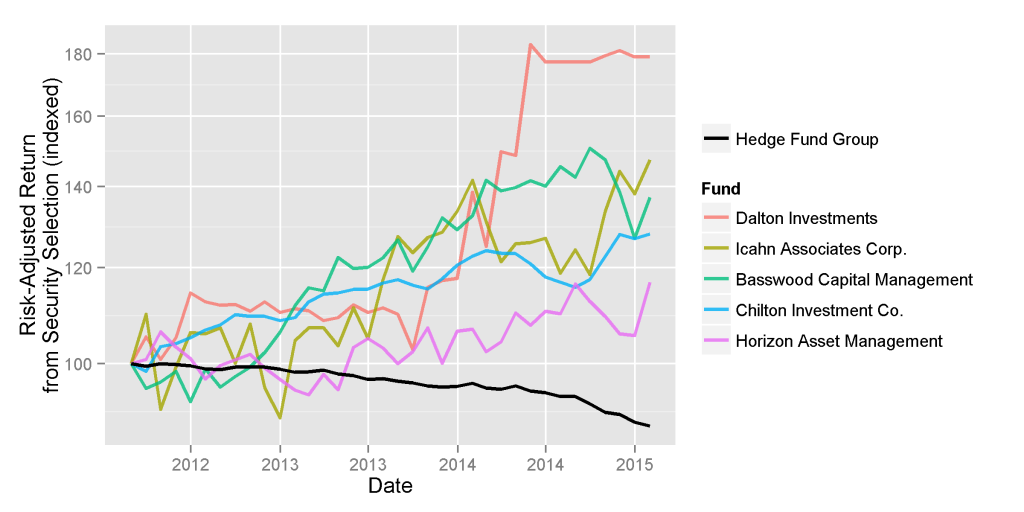
In the following chart we compare the energy αReturns of the top stock pickers to the returns of the group. The top stock pickers’ energy books made 20-80% more than they would have passively:

Chart of the risk-adjusted return from long energy sector security selection of the hedge funds with top performance in the sector

Energy Sector Return from Long Security Selection of the Top Energy Hedge Funds

Fund Energy Sector Security Selection αReturn
Long Positions
Dalton Investments LLC 79.00
Icahn Associates Corp. 47.31
Basswood Capital Management LLC 37.14
Chilton Investment Co. LLC 27.92
Horizon Asset Management LLC 16.74

Top Energy Hedge Funds’ Trades

Since stock picking skills are persistent and predictive, the trades and positions of the best and worst stock pickers are predictive of future stock performance. Investors should pay attention to the bets of the top managers.

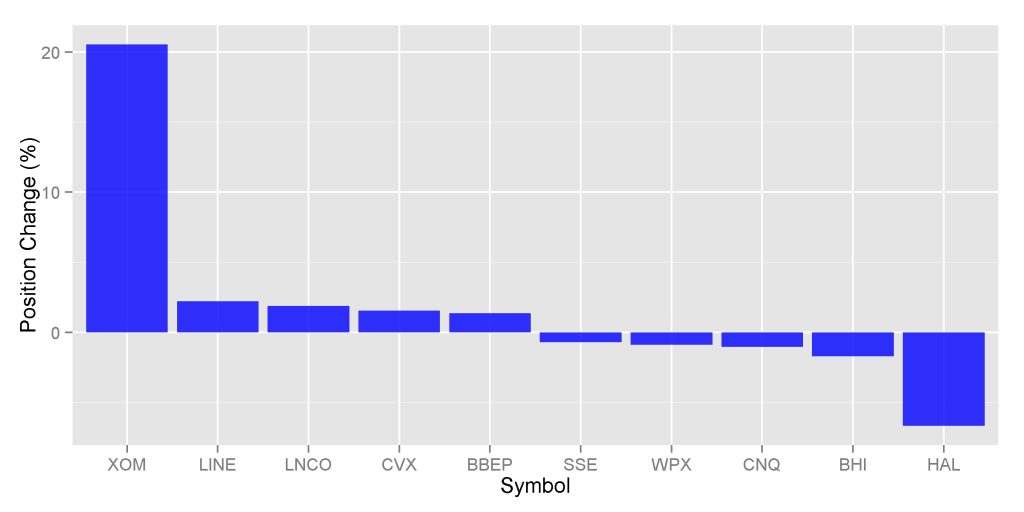
We averaged the energy positions of these top performers. The following were their largest position increases and decreases during Q4 2014:

Chart of the average changes in energy sector positions of the top energy stock picking hedge funds

Energy Sector Position Changes of the Top Energy Hedge Funds

Symbol Name Position Change (%)
XOM Exxon Mobil Corporation 20.54
LINE Linn Energy, LLC 2.22
LNCO LinnCo. LLC 1.89
CVX Chevron Corporation 1.55
BBEP BreitBurn Energy Partners L.P. 1.38
SSE Seventy Seven Energy Inc -0.71
WPX WPX Energy, Inc. Class A -0.88
CNQ Canadian Natural Resources Limited -1.04
BHI Baker Hughes Incorporated -1.73
HAL Halliburton Company -6.68

Top Energy Hedge Funds’ Positions

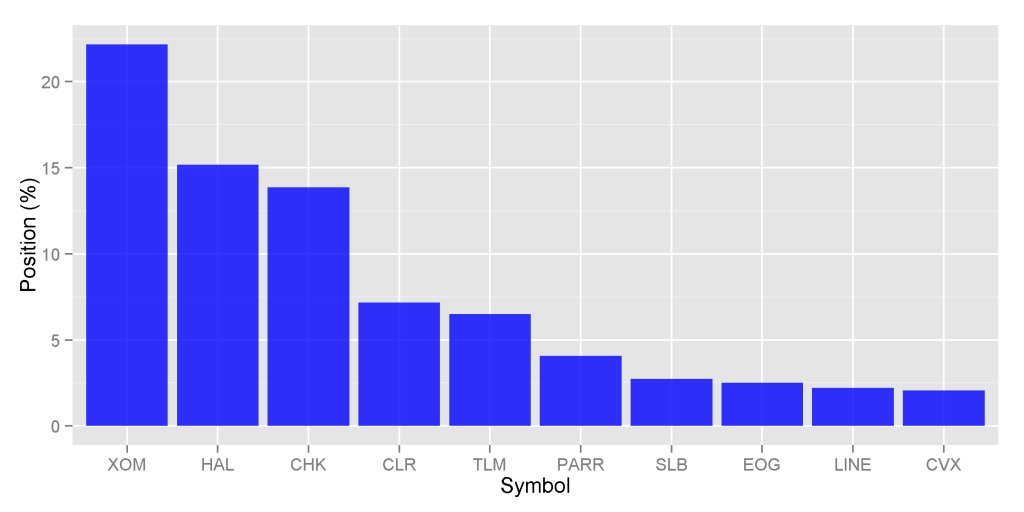
At 12/31/2014, the top performers’ average portfolio consisted of the following positions:

Chart of the average energy sector positions of hedge funds with top energy sector security selection performance

Energy Sector Positions of the Top Energy Hedge Funds

Symbol Name Position (%)
XOM Exxon Mobil Corporation 22.16
HAL Halliburton Company 15.19
CHK Chesapeake Energy Corporation 13.86
CLR Continental Resources, Inc. 7.17
TLM Talisman Energy Inc. 6.51
PARR Par Petroleum Corporation 4.08
SLB Schlumberger NV 2.74
EOG EOG Resources, Inc. 2.52
LINE Linn Energy, LLC 2.22
CVX Chevron Corporation 2.07

Conclusions

  • The hedge fund industry has a poor track record selecting long energy stocks. A typical fund would have done better investing passively, and outside investors would do well to short crowded picks in the sector.
  • Despite the poor industry performance, some funds do have excellent energy stock picking records. These records are persistent and predictive.
  • In recent months, the top energy funds have increased their XOM position and cut HAL. HAL remained a top bet, along with XOM and CHK.
The information herein is not represented or warranted to be accurate, correct, complete or timely.
Past performance is no guarantee of future results.
Copyright © 2012-2015, 
AlphaBetaWorks, a division of Alpha Beta Analytics, LLC. All rights reserved.
Content may not be republished without express written consent.

Hedge Fund Crowding Toll: January 2015

Several of our articles discussed the vulnerability of crowded hedge fund positions to volatilitymass liquidation, and losses. We illustrated specific blow-ups (SanDisk (SNDK) and eHealth (EHTH)), as well as sectors with persistently poor hedge fund performance (Oil and Gas Production and Miscellaneous Mining). However, we have not showed how representative these examples are. This piece illustrates the performance toll of hedge fund crowding in a single (especially damaging) month – January 2015.

Identifying Crowding

We analyze hedge fund holdings (HF Aggregate) relative to the market portfolio (Market Aggregate). HF Aggregate is position-weighted while Market Aggregate is capitalization-weighted. We follow the approach of our earlier articles on aggregate and sector-specific hedge fund crowding.

January 2015 Hedge Fund Crowding Toll

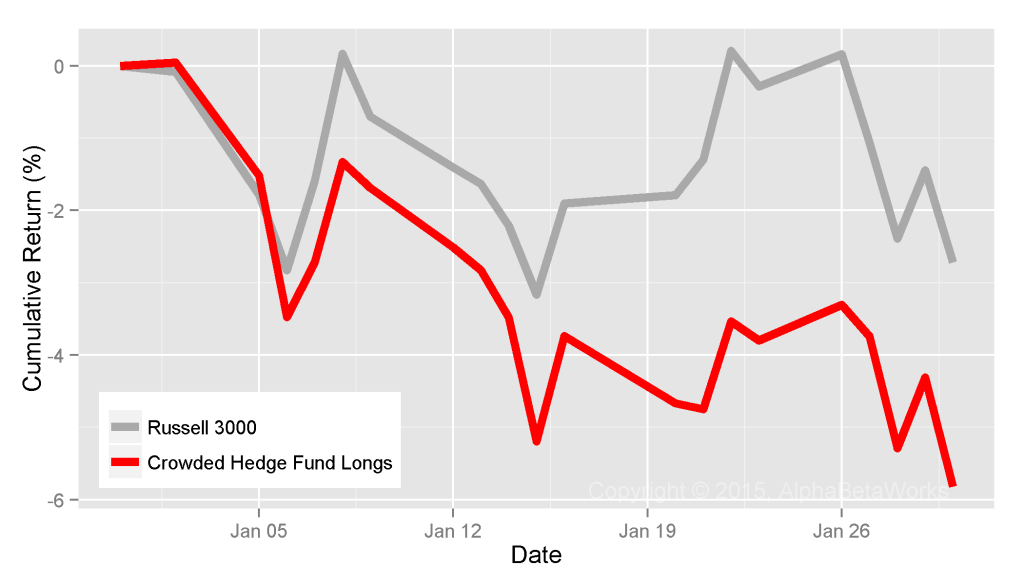
January 2015 is a convenient month to consider: Due to intra-month volatility, the market was approximately flat at several dates. Hence, relative performance at these points gives a good picture of risk-adjusted performance. Whereas Russell 3000 was down about 2.7%, the portfolio of equal-weighted crowded hedge fund longs (in red on the chart below) declined twice as much:

Chart of the January 2015 performance of crowded long hedge fund bets

January 2015 Performance of Crowded Hedge Fund Long Bets

The crowded hedge fund longs in the above chart consist of HF Aggregate’s illiquid long bets relative to the Market Aggregate. Illiquid longs are overweight exposures of HF Aggregate valued at over 10 days of trading volume. We have discussed earlier that illiquidity is a key source of crowding risk since funds have difficulty exiting these positions. The specific 10 day limit was chosen arbitrarily. Below we show that results are consistent across a broad range of liquidity limits. The portfolio was constructed using AlphaBetaWorks’ Q3 2014 hedge fund crowding dataset, available to subscribers in late November.

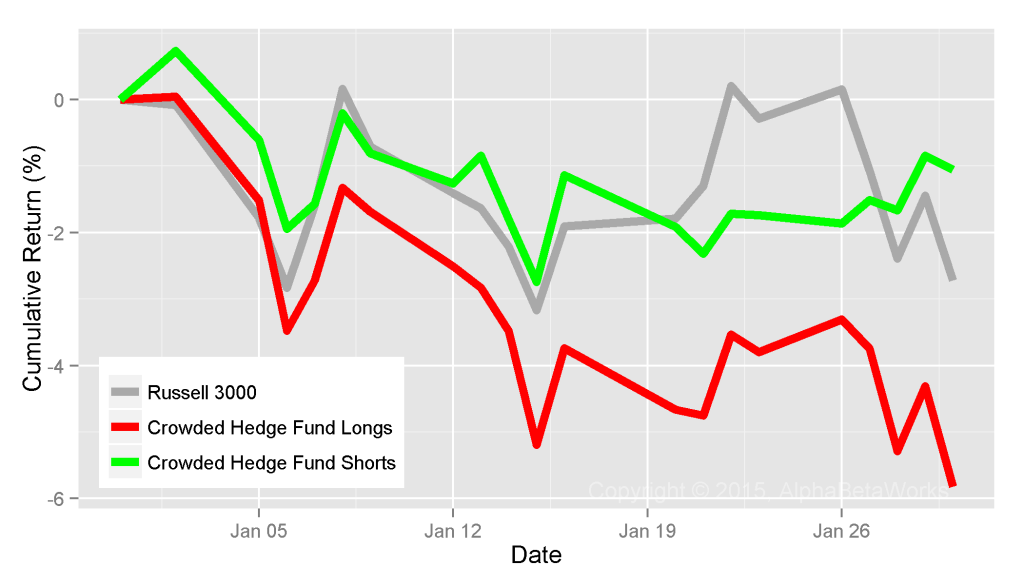
Crowded hedge fund shorts are defined similarly: They consist of illiquid underweights relative to the Market Aggregate valued at over 10 days of trading volume. Crowded shorts (in green on the chart below) slightly outperformed the market in January:

Chart of he January 2015 performance of the crowded hedge fund long and short bets

January 2015 Performance of Crowded Hedge Fund Long and Short Bets

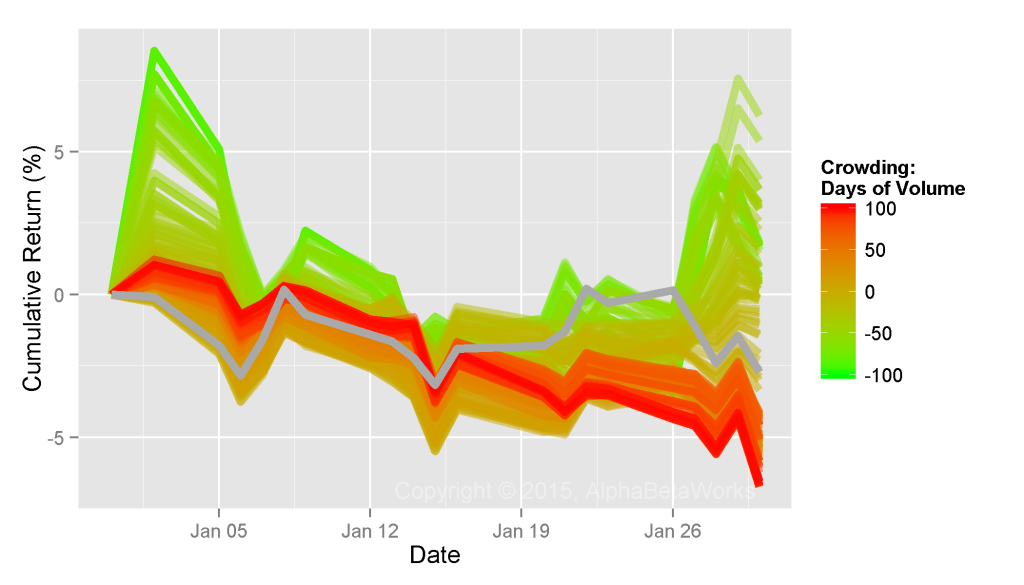
The performance of crowded hedge fund bets was roughly proportional to their crowding and liquidity. In the following chart, each line represents the performance of crowded hedge fund bets with a given level of crowding. Crowded and illiquid longs sized at 100 days of volume (red), underperformed crowded longs sized at 50 days (orange), etc. Meanwhile, illiquid shors (in shades of green) outperformed dramatically:

Chart of the January 2015 performance of crowded hedge fund bets as a function of liquidity

January 2015 Crowded Hedge Fund Bet Performance and Liquidity

In general, the larger and more illiquid a crowded hedge fund long bet was, the worse it fared. Even when a positive catalyst ought to lift a crowded long, impatient hedge fund holders may sell on the news, muting any upside. On the other hand, even when a negative catalyst ought to sink a crowded short, managers may buy on the news, muting any downside.

The damage covered a variety of industries and company sizes. Some of the notable losses in the crowded and illiquid long group were the following:

HF Aggregate Exposure

Symbol Name Value ($ mil) Liquidity (days) Performance (%)
NOR Noranda Aluminum Holding Corporation 103.80 40.19 -16.68
NMIH NMI Holdings, Inc. Class A 127.93 43.41 -16.71
AGYS Agilysys, Inc. 100.22 114.63 -18.42
RP RealPage, Inc. 112.04 10.96 -18.73
LPG Dorian LPG Ltd. 107.44 28.71 -19.01
TWI Titan International, Inc. 125.13 16.29 -19.09
HTZ Hertz Global Holdings, Inc. 2778.20 10.77 -20.46
DPM DCP Midstream Partners, LP 377.28 15.00 -20.85
HLF Herbalife Ltd. 982.00 10.42 -22.16
THRX Theravance, Inc. 321.32 19.18 -24.92
SALT Scorpio Bulkers, Inc. 139.66 32.25 -25.35
SXC SunCoke Energy, Inc. 161.15 16.09 -25.73
CACQ Caesars Acquisition Co. Class A 110.62 83.10 -29.25
SD SandRidge Energy, Inc. 317.85 11.38 -29.83
YRCW YRC Worldwide Inc. 280.23 15.99 -36.12
CZR Caesars Entertainment Corporation 245.84 10.74 -39.47
LE Lands’ End, Inc. 321.92 12.10 -46.47
ASPS Altisource Portfolio Solutions S.A. 245.55 10.77 -52.17
ADES Advanced Emissions Solutions, Inc. 107.92 41.21 -77.55
OCN Ocwen Financial Corporation 910.00 12.37 -87.76

Some of the notable gains in the crowded short group were the following:

HF Aggregate Exposure

Symbol Name Value ($ mil) Liquidity (days) Performance (%)
SBUX Starbucks Corporation -766.74 -2.02 6.78
KR Kroger Co. -390.36 -1.81 6.80
SPG Simon Property Group, Inc. -508.85 -1.90 6.83
LUV Southwest Airlines Co. -767.17 -1.88 6.89
NS NuStar Energy L.P. -141.06 -3.79 6.97
PRXL PAREXEL International Corporation -277.74 -6.47 7.09
BAH Booz Allen Hamilton Holding Corporation Class A -140.18 -7.13 7.60
ICLR ICON Plc -281.30 -9.46 8.28
GILD Gilead Sciences, Inc. -2122.35 -1.29 9.56
BA Boeing Company -2372.83 -4.29 9.78
NEU NewMarket Corporation -178.11 -10.24 10.35
PBYI Puma Biotechnology, Inc. -109.17 -1.57 10.75
ATK Alliant Techsystems Inc. -108.27 -2.90 11.02
TMUS T-Mobile US, Inc. -149.48 -1.11 11.13
BIIB Biogen Idec Inc. -1221.11 -2.01 12.86
SLXP Salix Pharmaceuticals, Ltd. -695.73 -2.19 14.75
PCRX Pacira Pharmaceuticals, Inc. -249.52 -4.43 16.82
CLR Continental Resources, Inc. -535.76 -3.54 17.56
HAR Harman International Industries, Incorporated -111.76 -1.31 19.27
ICPT Intercept Pharmaceuticals, Inc. -378.15 -4.27 25.29

January 2015 was an especially costly month for crowded hedge fund ideas, but it illustrated a broad and consistent effect. Crowding takes a heavy toll on performance and warrants close scrutiny from portfolio managers, analysts, and allocators.

The information herein is not represented or warranted to be accurate, correct, complete or timely.
Past performance is no guarantee of future results.
Copyright © 2012-2015, AlphaBetaWorks, a division of Alpha Beta Analytics, LLC. All rights reserved.
Content may not be republished without express written consent.

Hedge Fund Crowding Costs – eHealth

EHTH (eHealth, Inc.), an Internet health insurance agency, was down over 50% following disappointing revenue and EPS guidance. The events were yet another example of the mass sell-offs in crowded hedge fund bets after disappointing news. This once again demonstrates that investors must monitor their portfolios for crowding.

EHTH was not the largest stock-specific hedge fund insurance sector bet, but it was one of the least liquid. The aggregate crowded position constituted about nine days’ trading volume. As funds struggled to exit, more shares traded in one day than in the prior week, knocking the price down 54%. We illustrate how investors aware of this crowding could have avoided the losses.

To explore crowding we analyze hedge fund Life and Health Insurance Sector holdings (HF Sector Aggregate) relative to the Sector Market Portfolio (Sector Aggregate). HF Sector Aggregate is position-weighted while Sector Aggregate is capitalization-weighted. This follows the approach of our earlier articles on aggregate and sector-specific hedge fund crowding. Crowded positions are vulnerable to volatility, mass liquidation, and losses; they persistently underperform in some sectors.

Hedge Fund Life and Health Insurance Performance

The figure below plots historical return of HF Life and Health Insurance Aggregate. Factor return is due to systematic (market) risk. Blue area represents positive and gray area represents negative risk-adjusted returns from security selection (αReturn). Crowded bets underperformed the factor portfolio by over 35%:

Chart of the historical factor and idiosyncratic performance of the Hedge Fund Life and Health Insurance Sector Aggregate

Hedge Fund Life and Health Insurance Sector Aggregate Historical Performance

Hedge Fund Life and Health Insurance Risk-Adjusted Performance

The risk-adjusted return from security selection (αReturn) of HF Sector Aggregate is the return it would have generated if markets were flat – all market effects on performance have been eliminated. This is the idiosyncratic performance of the crowded portfolio. Crowded bets in this sector are especially dangerous, given their propensity to disappoint:

Chart of the historical security selection (stock picking) performance of the Hedge Fund Life and Health Insurance Sector Aggregate

Hedge Fund Life and Health Insurance Sector Aggregate Historical Security Selection Performance

Crowded Hedge Fund Life and Health Insurance Ideas

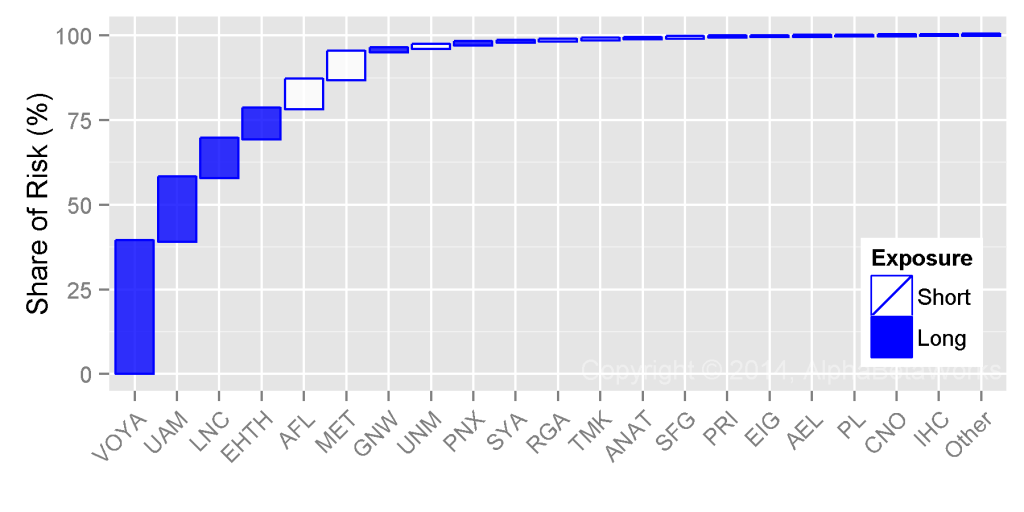
The following stocks contributed most to the relative residual (security-specific) risk of the HF Sector Aggregate as of Q3 2014. Blue bars represent long (overweight) exposures relative to Sector Aggregate. White bars represent short (underweight) exposures. Bar height represents contribution to relative stock-specific risk:

Chart of the contribution to the residual (stock-specific) risk of the crowded hedge fund Life and Health Insurance Sector bets

Crowded Hedge Fund Life and Health Insurance Sector Bets

The following table contains detailed data on these crowded ideas:

Exposure (%) Net Exposure Share of Risk (%)
HF Sector Aggr. Sector Aggr. % $mil Days of Trading
VOYA Voya Financial, Inc. 29.79 5.83 23.96 375.4 4.5 39.08
UAM Universal American Corp. 8.73 0.39 8.34 130.7 123.5 18.76
LNC Lincoln National Corporation 23.20 8.45 14.75 231.2 1.9 11.48
EHTH eHealth, Inc. 3.55 0.26 3.29 51.6 8.9 8.98
AFL Aflac Incorporated 1.05 15.94 -14.88 -233.2 -1.6 8.52
MET MetLife, Inc. 12.56 36.31 -23.75 -372.1 -1.1 8.15
GNW Genworth Financial, Inc. Class A 5.55 3.93 1.62 25.4 0.3 1.04
UNM Unum Group 0.92 5.29 -4.37 -68.5 -1.0 0.97
PNX Phoenix Companies, Inc. 1.59 0.19 1.39 21.9 9.5 0.87
SYA Symetra Financial Corporation 3.75 1.63 2.12 33.1 3.6 0.42
RGA Reinsurance Group of America, Incorporat 0.55 3.32 -2.76 -43.3 -1.4 0.28
TMK Torchmark Corporation 0.00 4.13 -4.13 -64.7 -1.5 0.27
ANAT American National Insurance Company 0.00 1.82 -1.82 -28.6 -17.4 0.27
SFG StanCorp Financial Group, Inc. 0.00 1.64 -1.64 -25.6 -1.8 0.24
PRI Primerica, Inc. 0.00 1.58 -1.58 -24.8 -1.7 0.16
EIG Employers Holdings, Inc. 1.06 0.37 0.69 10.8 4.1 0.10
AEL American Equity Investment Life Holding 0.13 1.03 -0.91 -14.2 -0.7 0.09
PL Protective Life Corporation 2.41 3.32 -0.91 -14.2 -0.3 0.08
CNO CNO Financial Group, Inc. 3.11 2.13 0.98 15.4 0.6 0.07
IHC Independence Holding Company 0.60 0.14 0.46 7.2 42.1 0.05
Other Positions 0.03 0.11
Total 100.00

The table above shows that, while EHTH was neither the highest contributor to risk nor the most illiquid, it was one of the top bets in each category. When the bad news came, its value halved. VOYA, UAM, and LNC, the other large and illiquid bets, are also at risk. Even when a positive catalyst arrives, impatient hedge fund holders may sell on the news, muting any upside. Whether or not investors choose to steer clear of crowded names, they must monitor them. With proper data, this attention to crowding can prevent “unexpected” volatility.

Conclusion

eHealth illustrates the vulnerability of crowded and illiquid positions to disorderly liquidation. eHealth was especially dangerous, given the tendency of crowded hedge fund life and health insurance ideas to disappoint. Investors armed with hedge fund crowding insights could have avoided these losses.

The information herein is not represented or warranted to be accurate, correct, complete or timely.
Past performance is no guarantee of future results.
Copyright © 2012-2015, AlphaBetaWorks, a division of Alpha Beta Analytics, LLC. All rights reserved.
Content may not be republished without express written consent.