Equity risk models can be complex and hard to interpret. Yet, when properly constructed, robust statistical equity risk models capturing just the most salient factors are highly predictive. For instance, Market and Sector/Industry factors alone deliver 0.96 median correlation between predictions of equity risk models and reported portfolio returns for U.S. Equity Mutual Funds.
Predictive Power of Statistical Equity Risk Models
We analyze historical positions and returns of approximately 3,000 non-index U.S. Equity Mutual Funds over 10 years. We calculate factor exposures using estimated holdings at the end of each month and predict next month’s performance using these ex-ante factor exposures and ex-post factor returns.
The correlation between an equity risk model’s predictions and subsequently reported fund returns illustrates the model’s power. The higher the correlation, the more effective a model is at hedging, attributing returns to systematic sources, and evaluating manager skill.
Testing Predictions of Single-Factor Statistical Equity Risk Models
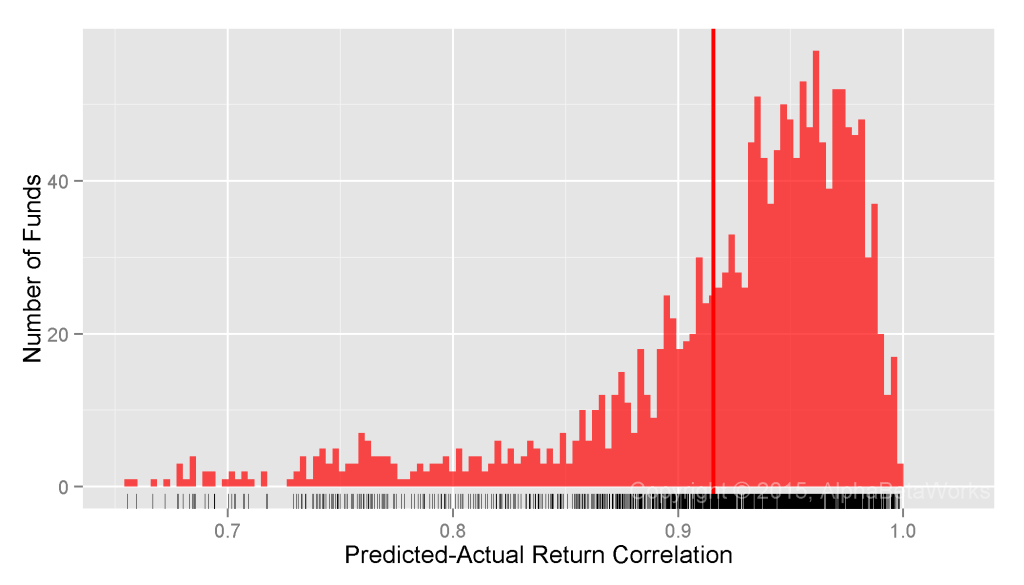
The simplest statistical equity risk model uses a single systematic risk factor – Market Beta. Since Market Beta is the dominant factor behind portfolio performance, even a very simple model built with robust methods delivers 0.92 mean and 0.94 median correlation between predicted and actual monthly returns:

U.S. Equity Mutual Funds: Correlation between a single-factor statistical equity risk model’s predictions and actual monthly returns
  Min.    1st Qu. Median  Mean    3rd Qu. Max.
  0.1360  0.9010  0.9401  0.9157  0.9650  0.9981
Testing Predictions of Two-Factor Statistical Equity Risk Models
Research indicates that sector/industry risk factors capture more systematic portfolio risk than style factors do. For instance, in periods such as 1999-2001 the performance of common style factors is due to difference in sector composition of style portfolios.
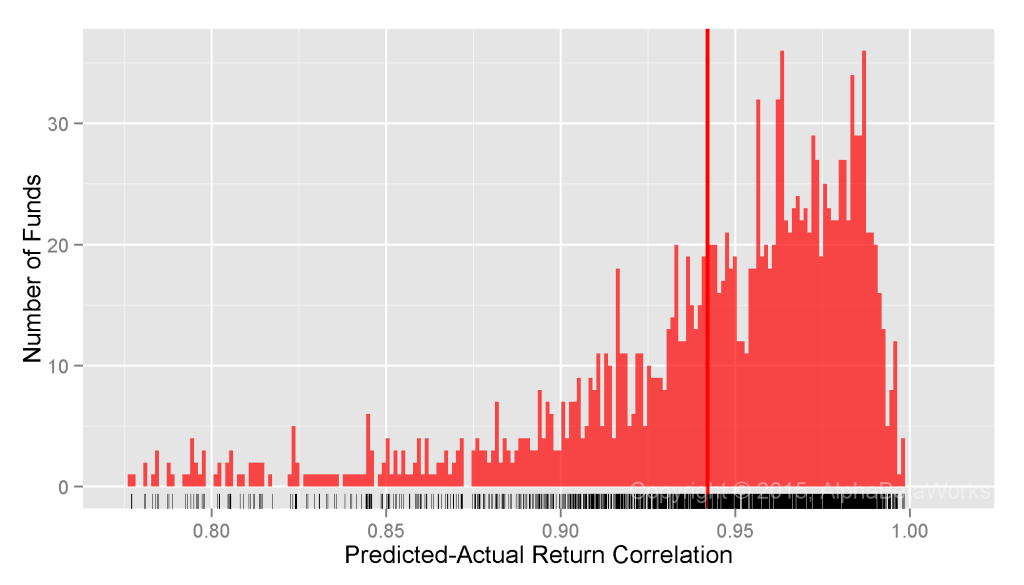
Thus, we consider a two-factor model that adds a Sector Risk Factor. Each security belongs to one of 10 sectors. Market and Sector Betas, estimated with robust methods delivers 0.94 mean and 0.96 median correlation between predicted and actual monthly returns:

U.S. Equity Mutual Funds: Correlation between a two-factor statistical equity risk model’s predictions and actual monthly returns
  Min.    1st Qu. Median  Mean    3rd Qu. Max.
  0.6639  0.9254  0.9562  0.9420  0.9753  0.9984
Testing Predictions of Multi-Factor Statistical Equity Risk Models
With correlation between predicted and actual returns very close to 1, the benefit of increased model complexity is rapidly diminishing. Even a perfect model would, at most, provide 0.0438 higher correlation, or explain 0.0857 higher fraction of ex-post variance for most funds than the above two-factor model.
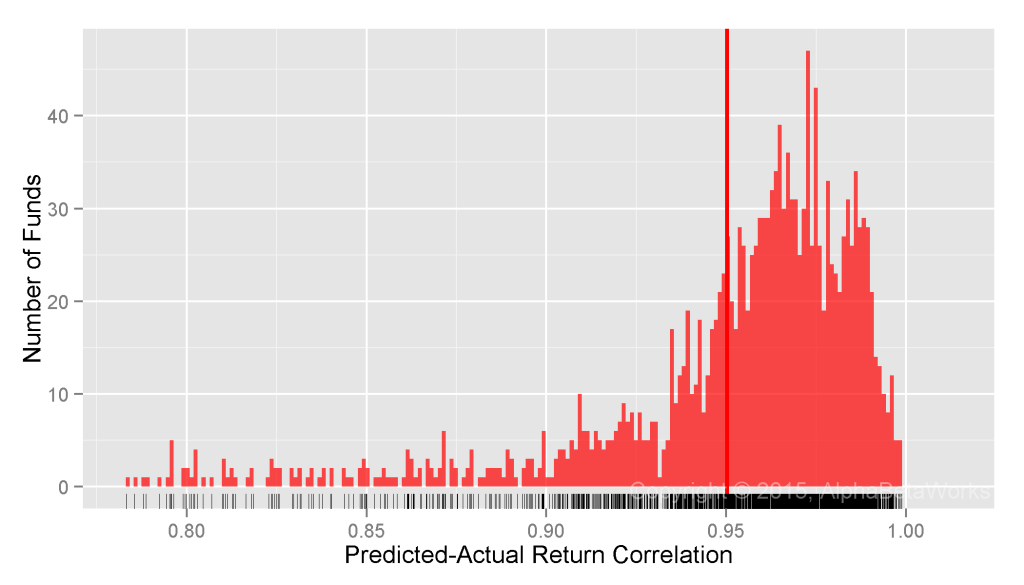
Extending the two-factor model with Style Factors (Value/Growth and Size) as well as Macroeconomic Factors (Bonds, Oil, Currency, etc.), we arrive at the AlphaBetaWorks’ U.S. Equity Statistical Risk Model. It delivers 0.95 mean and 0.96 median correlation between predicted and actual monthly returns for U.S. Equity Mutual Funds:

U.S. Equity Mutual Funds: Correlation between a multi-factor statistical equity risk model’s predictions and actual monthly returns
  Min.    1st Qu. Median  Mean    3rd Qu. Max.
  0.6661  0.9420  0.9629  0.9503  0.9766  0.9987
Even for the 25% funds it handles the worst, the model delivers 0.67-0.94 correlation between predicted and actual returns.
Summary
- Complex equity risk models with non-intuitive factors may offer no better predictions than robust models with a few intuitive factors.
- Even a perfect equity risk model would, at most, explain 8.6% more ex-post variance than a simple two-factor model.
- For a typical U.S. mutual fund, a statistical equity risk model with intuitive and investable factors delivers over 0.96 correlation between predicted and actual monthly returns.


