Tag Archives: factor exposures

Testing Predictions of Equity Risk Models

Equity risk models can be complex and hard to interpret. Yet, when properly constructed, robust statistical equity risk models capturing just the most salient factors are highly predictive. For instance, Market and Sector/Industry factors alone deliver 0.96 median correlation between predictions of equity risk models and reported portfolio returns for U.S. Equity Mutual Funds.

Predictive Power of Statistical Equity Risk Models

We analyze historical positions and returns of approximately 3,000 non-index U.S. Equity Mutual Funds over 10 years. We calculate factor exposures using estimated holdings at the end of each month and predict next month’s performance using these ex-ante factor exposures and ex-post factor returns.

The correlation between an equity risk model’s predictions and subsequently reported fund returns illustrates the model’s power. The higher the correlation, the more effective a model is at hedging, attributing returns to systematic sources, and evaluating manager skill.

Testing Predictions of Single-Factor Statistical Equity Risk Models

The simplest statistical equity risk model uses a single systematic risk factor – Market Beta. Since Market Beta is the dominant factor behind portfolio performance, even a very simple model built with robust methods delivers 0.92 mean and 0.94 median correlation between predicted and actual monthly returns:
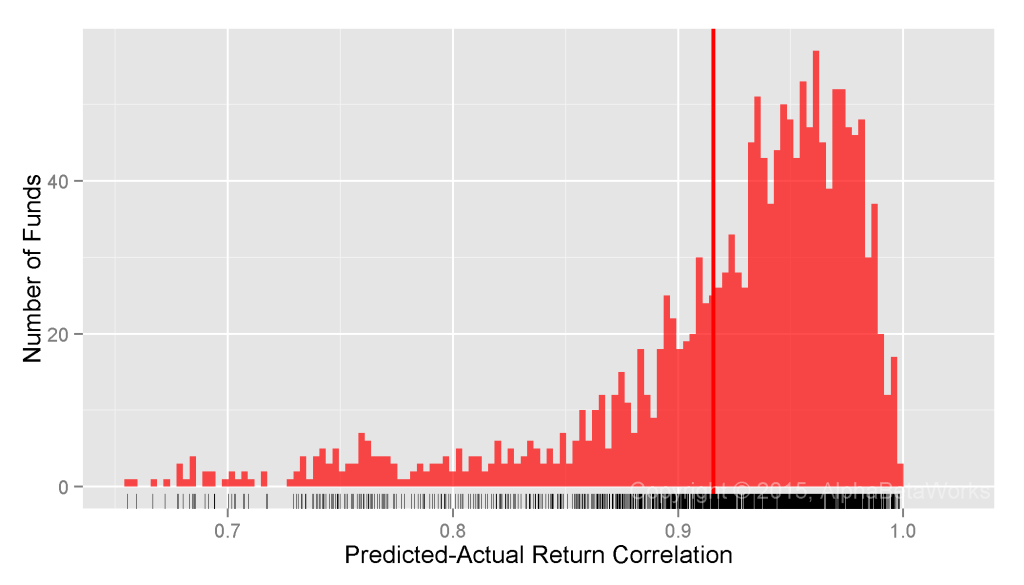
Chart of the correlations between predicted returns constructed using a single-factor statistical equity risk model and actual historical returns for U.S. Equity Mutual Funds

U.S. Equity Mutual Funds: Correlation between a single-factor statistical equity risk model’s predictions and actual monthly returns

  Min.    1st Qu. Median  Mean    3rd Qu. Max. 
  0.1360  0.9010  0.9401  0.9157  0.9650  0.9981

Testing Predictions of Two-Factor Statistical Equity Risk Models

Research indicates that sector/industry risk factors capture more systematic portfolio risk than style factors do. For instance, in periods such as 1999-2001 the performance of common style factors is due to difference in sector composition of style portfolios.

Thus, we consider a two-factor model that adds a Sector Risk Factor. Each security belongs to one of 10 sectors. Market and Sector Betas, estimated with robust methods delivers 0.94 mean and 0.96 median correlation between predicted and actual monthly returns:
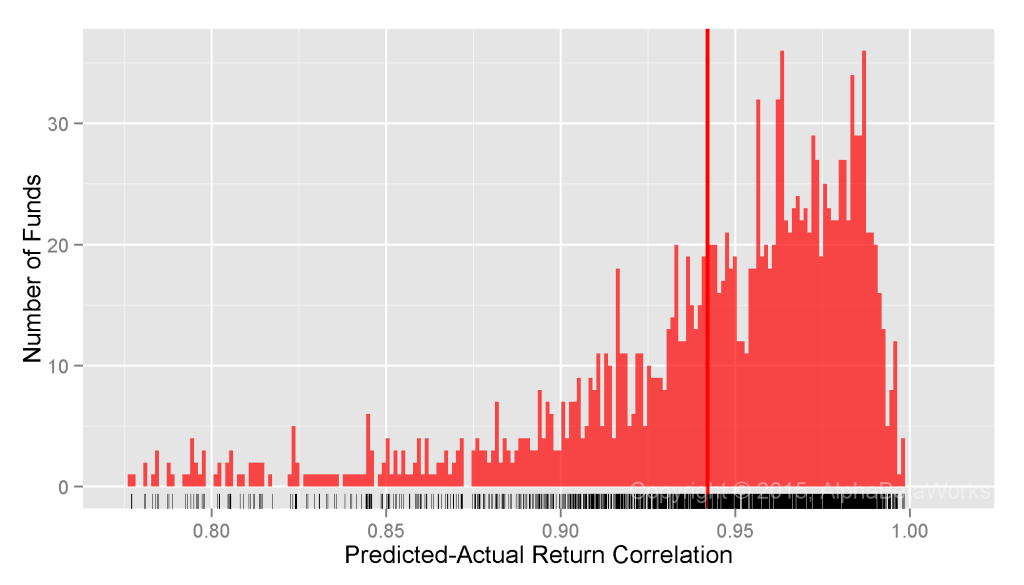
Chart of the correlations between predicted returns constructed using a two-factor statistical equity risk model and actual historical returns for U.S. Equity Mutual Funds

U.S. Equity Mutual Funds: Correlation between a two-factor statistical equity risk model’s predictions and actual monthly returns

  Min.    1st Qu. Median  Mean    3rd Qu. Max. 
  0.6639  0.9254  0.9562  0.9420  0.9753  0.9984

Testing Predictions of Multi-Factor Statistical Equity Risk Models

With correlation between predicted and actual returns very close to 1, the benefit of increased model complexity is rapidly diminishing. Even a perfect model would, at most, provide 0.0438 higher correlation, or explain 0.0857 higher fraction of ex-post variance for most funds than the above two-factor model.

Extending the two-factor model with Style Factors (Value/Growth and Size) as well as Macroeconomic Factors (Bonds, Oil, Currency, etc.), we arrive at the AlphaBetaWorks’ U.S. Equity Statistical Risk Model. It delivers 0.95 mean and 0.96 median correlation between predicted and actual monthly returns for U.S. Equity Mutual Funds:
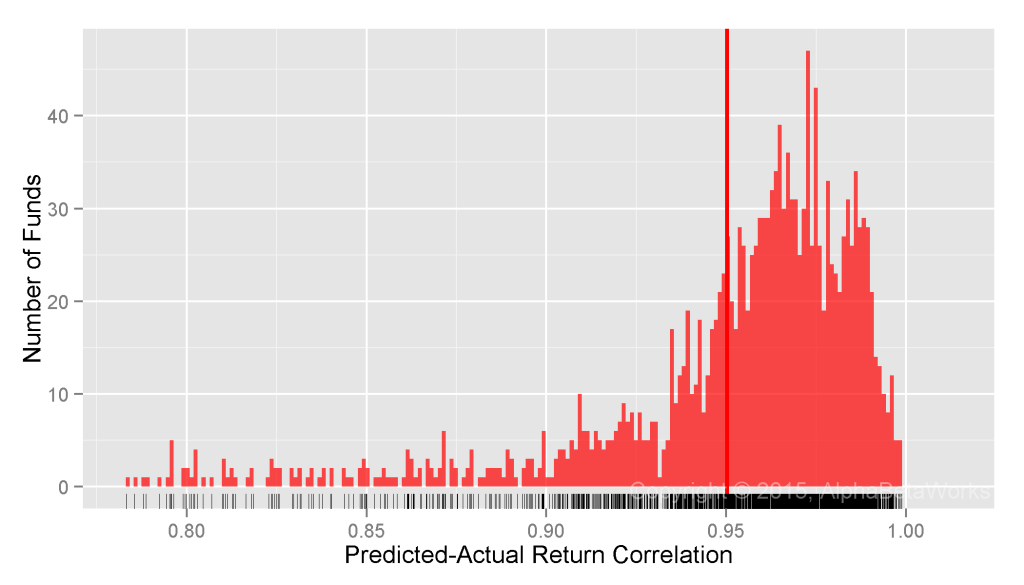
Chart of the correlations between predicted returns constructed using a multi-factor statistical equity risk model and actual historical returns for U.S. Equity Mutual Funds

U.S. Equity Mutual Funds: Correlation between a multi-factor statistical equity risk model’s predictions and actual monthly returns

  Min.    1st Qu. Median  Mean    3rd Qu. Max. 
  0.6661  0.9420  0.9629  0.9503  0.9766  0.9987

Even for the 25% funds it handles the worst, the model delivers 0.67-0.94 correlation between predicted and actual returns.

Summary

  • Complex equity risk models with non-intuitive factors may offer no better predictions than robust models with a few intuitive factors.
  • Even a perfect equity risk model would, at most, explain 8.6% more ex-post variance than a simple two-factor model.
  • For a typical U.S. mutual fund, a statistical equity risk model with intuitive and investable factors delivers over 0.96 correlation between predicted and actual monthly returns.
The information herein is not represented or warranted to be accurate, correct, complete or timely.
Past performance is no guarantee of future results.
Copyright © 2012-2015, AlphaBetaWorks, a division of Alpha Beta Analytics, LLC. All rights reserved.
Content may not be republished without express written consent.

Hedge Fund Industrials Factor Timing

In an earlier post, we discussed the largest bets hedge fund long portfolios were making in Q1 2015. The third largest was on the Industrials Factor. This is the risk specific to the industrials sector after controlling for market exposure. It captures capital allocation to industrials and sensitivity (beta) to the sector. There is weak statistical evidence of poor industrials factor timing by hedge funds – investors who follow hedge funds should either ignore this bet or treat it as a negative indicator.

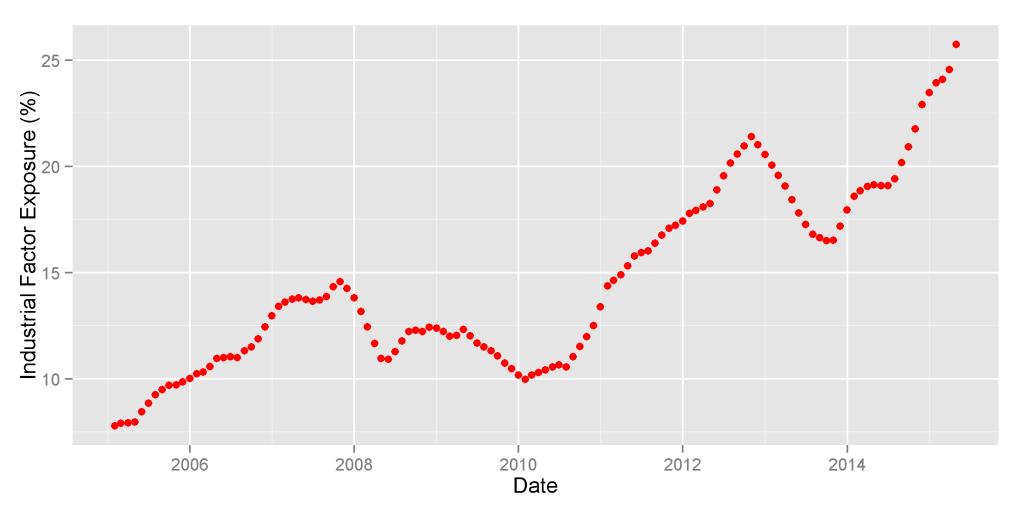
At the end of Q1 2015, high industrials sector factor exposure was the third largest source of U.S. hedge funds’ long portfolio crowding. HF Aggregate, a portfolio consisting of popular long U.S. equity holdings of all hedge funds tractable from quarterly filings, had over 25% industrials factor exposure – a 9% overweight relative to Market. This exposure was at an all-time high:

Chart of the historical industrials factor exposure of U.S. Hedge Fund Aggregate

U.S. Hedge Fund Aggregate’s Industrials Sector Factor Exposure History

This industrials factor exposure captures sector risk after controlling for market exposure. For example, a fund with 10% allocated to a broad industrials index will have approximately 10% industrials factor exposure. A fund with 10% allocated to a 2x-levered broad industrials ETF will have approximately 20% industrials factor exposure.

Here we analyze the hedge fund industry’s skill in timing the U.S. Industrials Factor by varying this exposure. The AlphaBetaWorks Performance Analytics Platform evaluates market timing skills and performance using two related tests:

  • Statistical test for the relationship between factor exposure and subsequent factor returns,
  • Statistical test for the size and consistency of returns generated by varying factor exposures.

Hedge Fund Industrials Factor Exposure and Industrials Factor Return

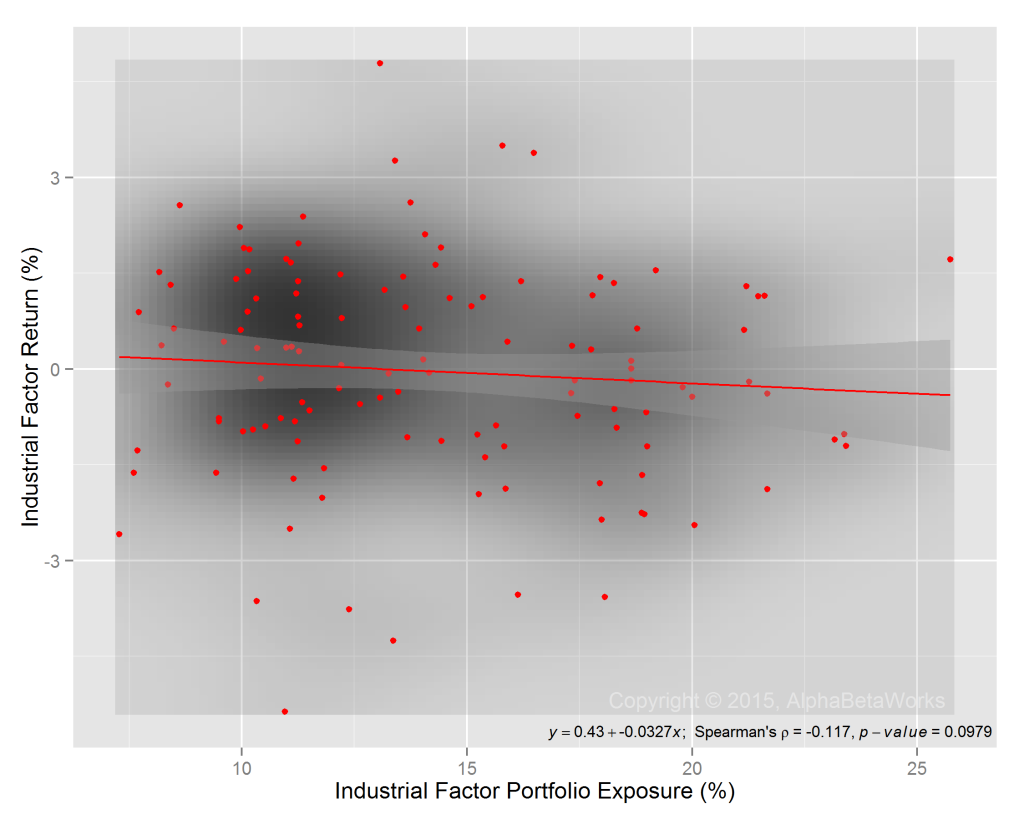
We calculated the Spearman’s rank correlation coefficient of HF Aggregate’s industrials factor exposure and subsequent industrials factor return for the past 10 years and tested it for significance. The chart below illustrates the correlation between the two series and the test results:

Chart of the correlation between historical industrials factor exposure of U.S. Hedge Fund Aggregate and subsequent factor return

U.S. Hedge Fund Aggregate’s Industrials Factor Exposure and Return

There is a statistically weak negative relationship between HF Aggregate’s industrials factor exposure and subsequent factor performance. Hedge fund industrials factor exposure is a weak predictor of future industrials returns.

Hedge Fund Industrials Factor Timing Returns

Over the past 10 years, HF Aggregate (USHFS in red) made approximately 0.9% less than it would have with constant industrials factor exposure, as illustrated below. The performance of HF Aggregate is compared to all tractable 13F filers (Group in gray). The AlphaBetaWorks Performance Analytics Platform identifies this performance due to industrials factor timing as industrials βReturn:

Chart of the cumulative historical contribution of variation in industrials factor exposure of U.S. Hedge Fund Aggregate to the Aggregate’s performance

U.S. Hedge Fund Aggregate’s Industrials Factor Timing Return

The weak evidence of poor industrials factor timing by the industry, combined with the high recent industrials factor exposure, is a weak bearish indicator for the sector.

Summary

  • The industrials factor exposure of U.S. hedge funds’ long portfolios is weakly predictive of subsequent sector performance.
  • Current hedge fund industrials factor exposure, at 10-year highs, is a weak bearish indicator for the Industrials Sector.
  • Investors who track hedge fund holdings should either ignore this bet or treat is as a negative indicator.
The information herein is not represented or warranted to be accurate, correct, complete or timely.
Past performance is no guarantee of future results.
Copyright © 2012-2015, AlphaBetaWorks, a division of Alpha Beta Analytics, LLC. All rights reserved.
Content may not be republished without express written consent.

Hedge Fund Oil Factor Timing

In an earlier post, we discussed the largest bets hedge fund long portfolios were making in Q1 2015. The second largest was on the oil price. This exposure is the residual oil price risk after controlling for market and sector exposures. It captures overweighting within various sectors of companies that out- or underperform under rising oil price. There is weak statistical evidence of skilled oil factor timing by hedge funds – the current bet is a weak bullish indicator for oil prices.

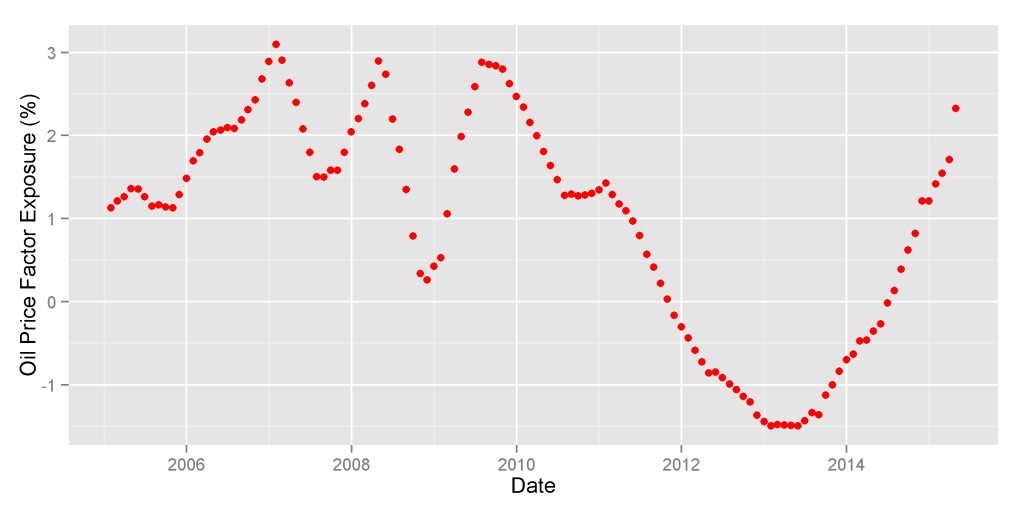
At the end of Q1 2015, high oil price factor exposure was the second largest source of U.S. hedge funds’ long portfolio crowding. HF Aggregate, a portfolio consisting of popular long U.S. equity holdings of all hedge funds tractable from quarterly filings, had approximately 2.5% oil price factor exposure. This exposure was approaching the 10-year highs reached in 2007-2009:

Chart of the exposure of oil price factor of the U.S. Hedge Fund Aggregate

U.S. Hedge Fund Aggregate’s Oil Factor Exposure History

This oil price exposure captures residual oil risk after controlling for sector exposures. For examples, airlines with higher operational or financial leverage than peers have negative oil price factor exposure – they will underperform peers when oil price increases; airlines with lower operational or financial leverage than peers have positive oil price factor exposure –they will outperform peers when oil price increases.

Here we analyze the hedge fund industry’s skill in timing the oil price by varying this intra-sector oil price risk. The AlphaBetaWorks Performance Analytics Platform evaluates market timing skills and performance using two related tests:

  • Statistical test for the relationship between factor exposure and subsequent factor returns,
  • Statistical test for the size and consistency of returns generated by varying factor exposures.

Hedge Fund Oil Factor Exposure and Oil Return

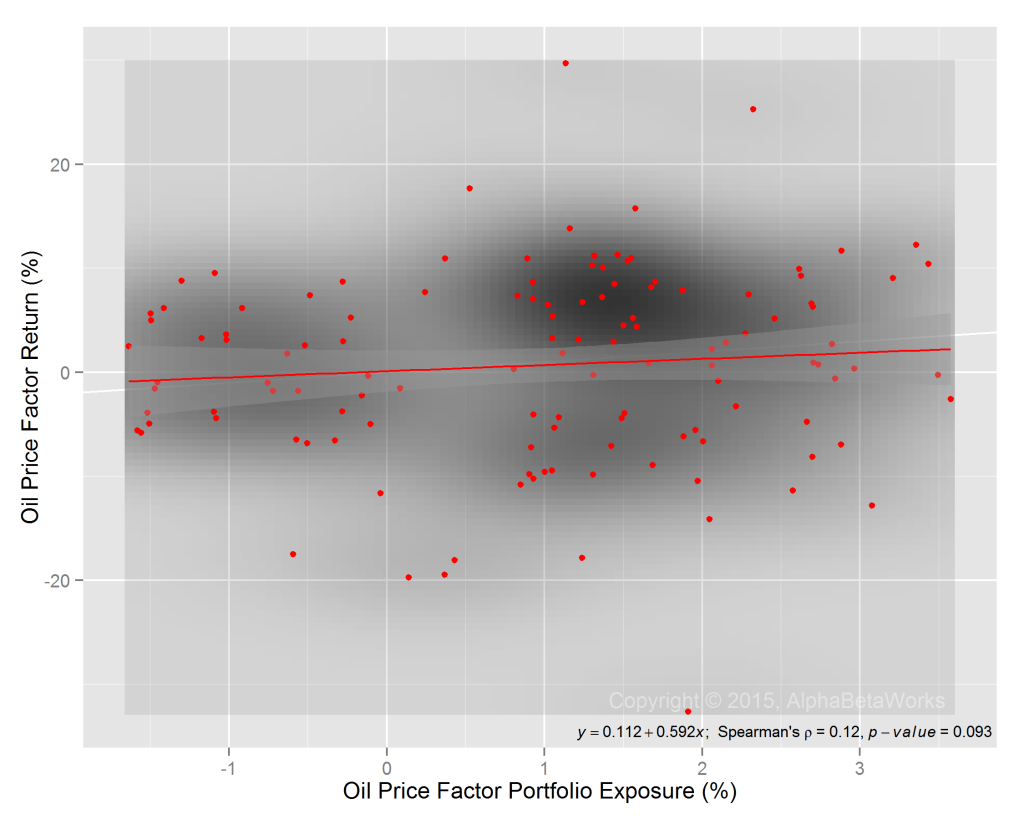
We calculated the Spearman’s rank correlation coefficient of HF Aggregate’s oil price factor exposure and subsequent oil price return and tested it for significance. The chart below illustrates the correlation between the two series and the test results:

Chart of the correlation between oil price factor exposure of the U.S. Hedge Fund Aggregate and subsequent oil price return

U.S. Hedge Fund Aggregate’s Oil Factor Exposure and Return

There is a statistically weak positive relationship between HF Aggregate’s oil factor exposure and subsequent oil performance. Hedge fund oil factor exposure is a weak indicator of future oil price direction.

Hedge Fund Oil Factor Timing Returns

Over the past 10 years, HF Aggregate (USHFS in red) made approximately 1.5% more than it would have with constant oil factor exposure, as illustrated below. The performance of HF Aggregate is compared to all tractable 13F filers (Group in gray). The AlphaBetaWorks Performance Analytics Platform identifies this performance due to oil price factor timing as oil price βReturn:

Chart of the return due to variation in oil price factor exposure of the U.S. Hedge Fund Aggregate

U.S. Hedge Fund Aggregate’s Oil Factor Timing Return

The weak evidence of oil factor timing skill by the industry, combined with the high recent oil factor exposure, is a weak bullish indicator for oil prices.

Summary

  • The oil price factor exposure of U.S. hedge funds’ long portfolios is weakly predictive of subsequent oil performance.
  • Current hedge fund oil factor exposure, near 10-year highs, is a weak bullish indicator for oil prices.
The information herein is not represented or warranted to be accurate, correct, complete or timely.
Past performance is no guarantee of future results.
Copyright © 2012-2015, AlphaBetaWorks, a division of Alpha Beta Analytics, LLC. All rights reserved.
Content may not be republished without express written consent.

Hedge Fund U.S. Market Timing

The single largest bet hedge fund long portfolios were making in Q1 2015 was on the U.S. market (high beta). While the bet is exceptionally large, it is not predictive of market direction. Allocators should pay attention to this risk aggregation.

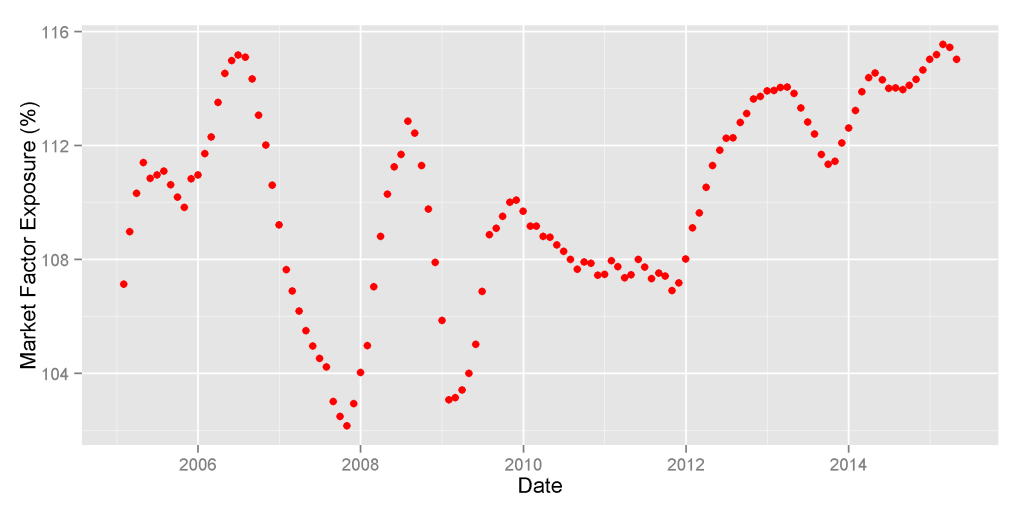
At the end of Q1 2015, high market factor exposure (high beta) was the primary source of U.S. hedge funds’ long portfolio crowding. HF Aggregate, a portfolio consisting of popular long U.S. equity holdings of all hedge funds tractable from quarterly filings, had approximately 115% U.S. market factor exposure (1.15 U.S. market beta). This exposure was at 10-year highs – the level last seen in mid-2006:

Chart of the historical U.S. Market Factor exposure of U.S. Hedge Fund Aggregate

U.S. Hedge Fund Aggregate’s U.S. Market Factor Exposure History

Our work on hedge fund crowding has so far not addressed hedge fund factor timing and hedge fund U.S. market timing specifically. We dive into this performance here.

The AlphaBetaWorks Performance Analytics Platform evaluates market timing skills and performance using two related tests:

  • Statistical test for the relationship between factor exposure and subsequent factor returns,
  • Statistical test for the size and consistency of returns generated by varying factor exposures.

Hedge Fund Market Exposure and Market Return

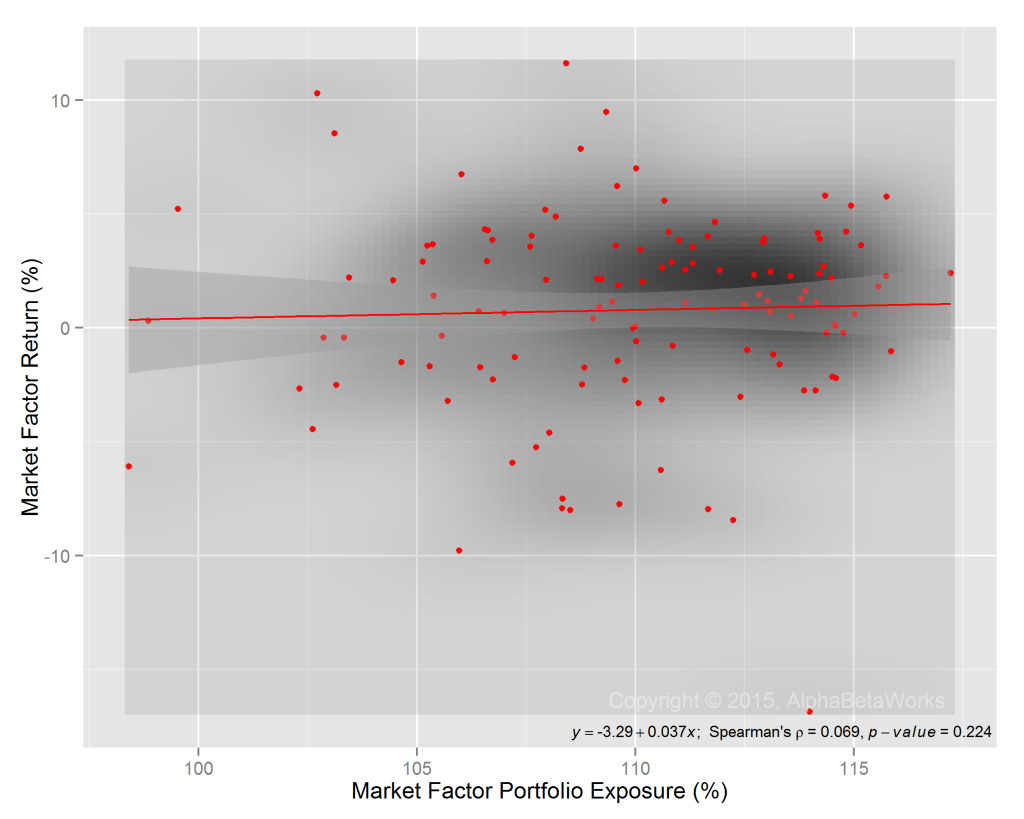
We calculated the Spearman’s rank correlation coefficient of HF Aggregate’s market exposure and subsequent market return and tested it for significance. The chart below illustrates the correlation between the two series and the test results:

Chart of the correlation between the U.S. market exposure of long U.S. hedge fund equity portfolios and U.S. market return

U.S. Hedge Fund Aggregate’s U.S. Market Exposure and Return

The chart shows that there is a positive relationship between HF Aggregate’s U.S. market exposure and subsequent U.S. market return, but it is weak and statistically insignificant. In other words, hedge funds’ variation in U.S. market exposure has done little to help their performance.

Hedge Fund U.S. Market Timing Returns

Over the past 10 years, HF Aggregate (USHFS in red) made approximately 1% more than it would have with constant factor exposures, as illustrated below. The performance of HF Aggregate is compared to all tractable 13F filers (Group in gray). The AlphaBetaWorks Performance Analytics Platform identifies this performance due to U.S. market factor timing as U.S. market βReturn:

Chart of the historical return due to variation in U.S. market exposure of long U.S. hedge fund equity portfolios

U.S. Hedge Fund Aggregate’s U.S. Market Timing Return

The performance impact of this variation in beta within U.S. hedge fund long portfolios is also minor. However, the group of all 13F filers was a poor market timer, particularly during the volatility of 2008-2009. During the crisis, non-filers were the smart money and took advantage of U.S. market volatility, at the expense of 13F filers. 13F filers were a contrarian indicator.

Summary

  • Hedge fund long equity portfolios consistently take 5-15% more market risk than S&P500 and other broad market benchmarks.
  • There has been no statistically significant relationship between U.S. market exposure (market beta) of U.S. hedge funds’ long portfolios and subsequent market return.
  • The high market factor exposure of U.S. hedge funds’ long portfolios is not predictive of subsequent market returns.
  • The broader group of all 13F filers generated significant negative returns by varying market exposure, particularly during the 2008-2009 volatility.
The information herein is not represented or warranted to be accurate, correct, complete or timely.
Past performance is no guarantee of future results.
Copyright © 2012-2015, AlphaBetaWorks, a division of Alpha Beta Analytics, LLC. All rights reserved.
Content may not be republished without express written consent.