Author Archives: alphabetaworks

Top Energy Hedge Funds’ Trades

Energy investments have struggled in recent months. Crowded hedge fund energy bets have done especially poorly. In this piece, we explore the overall hedge fund energy performance and the results of the top stock pickers in the Oil and Gas Production, Integrated Oil, and Oilfield Services Sectors.

Top Energy Hedge Funds

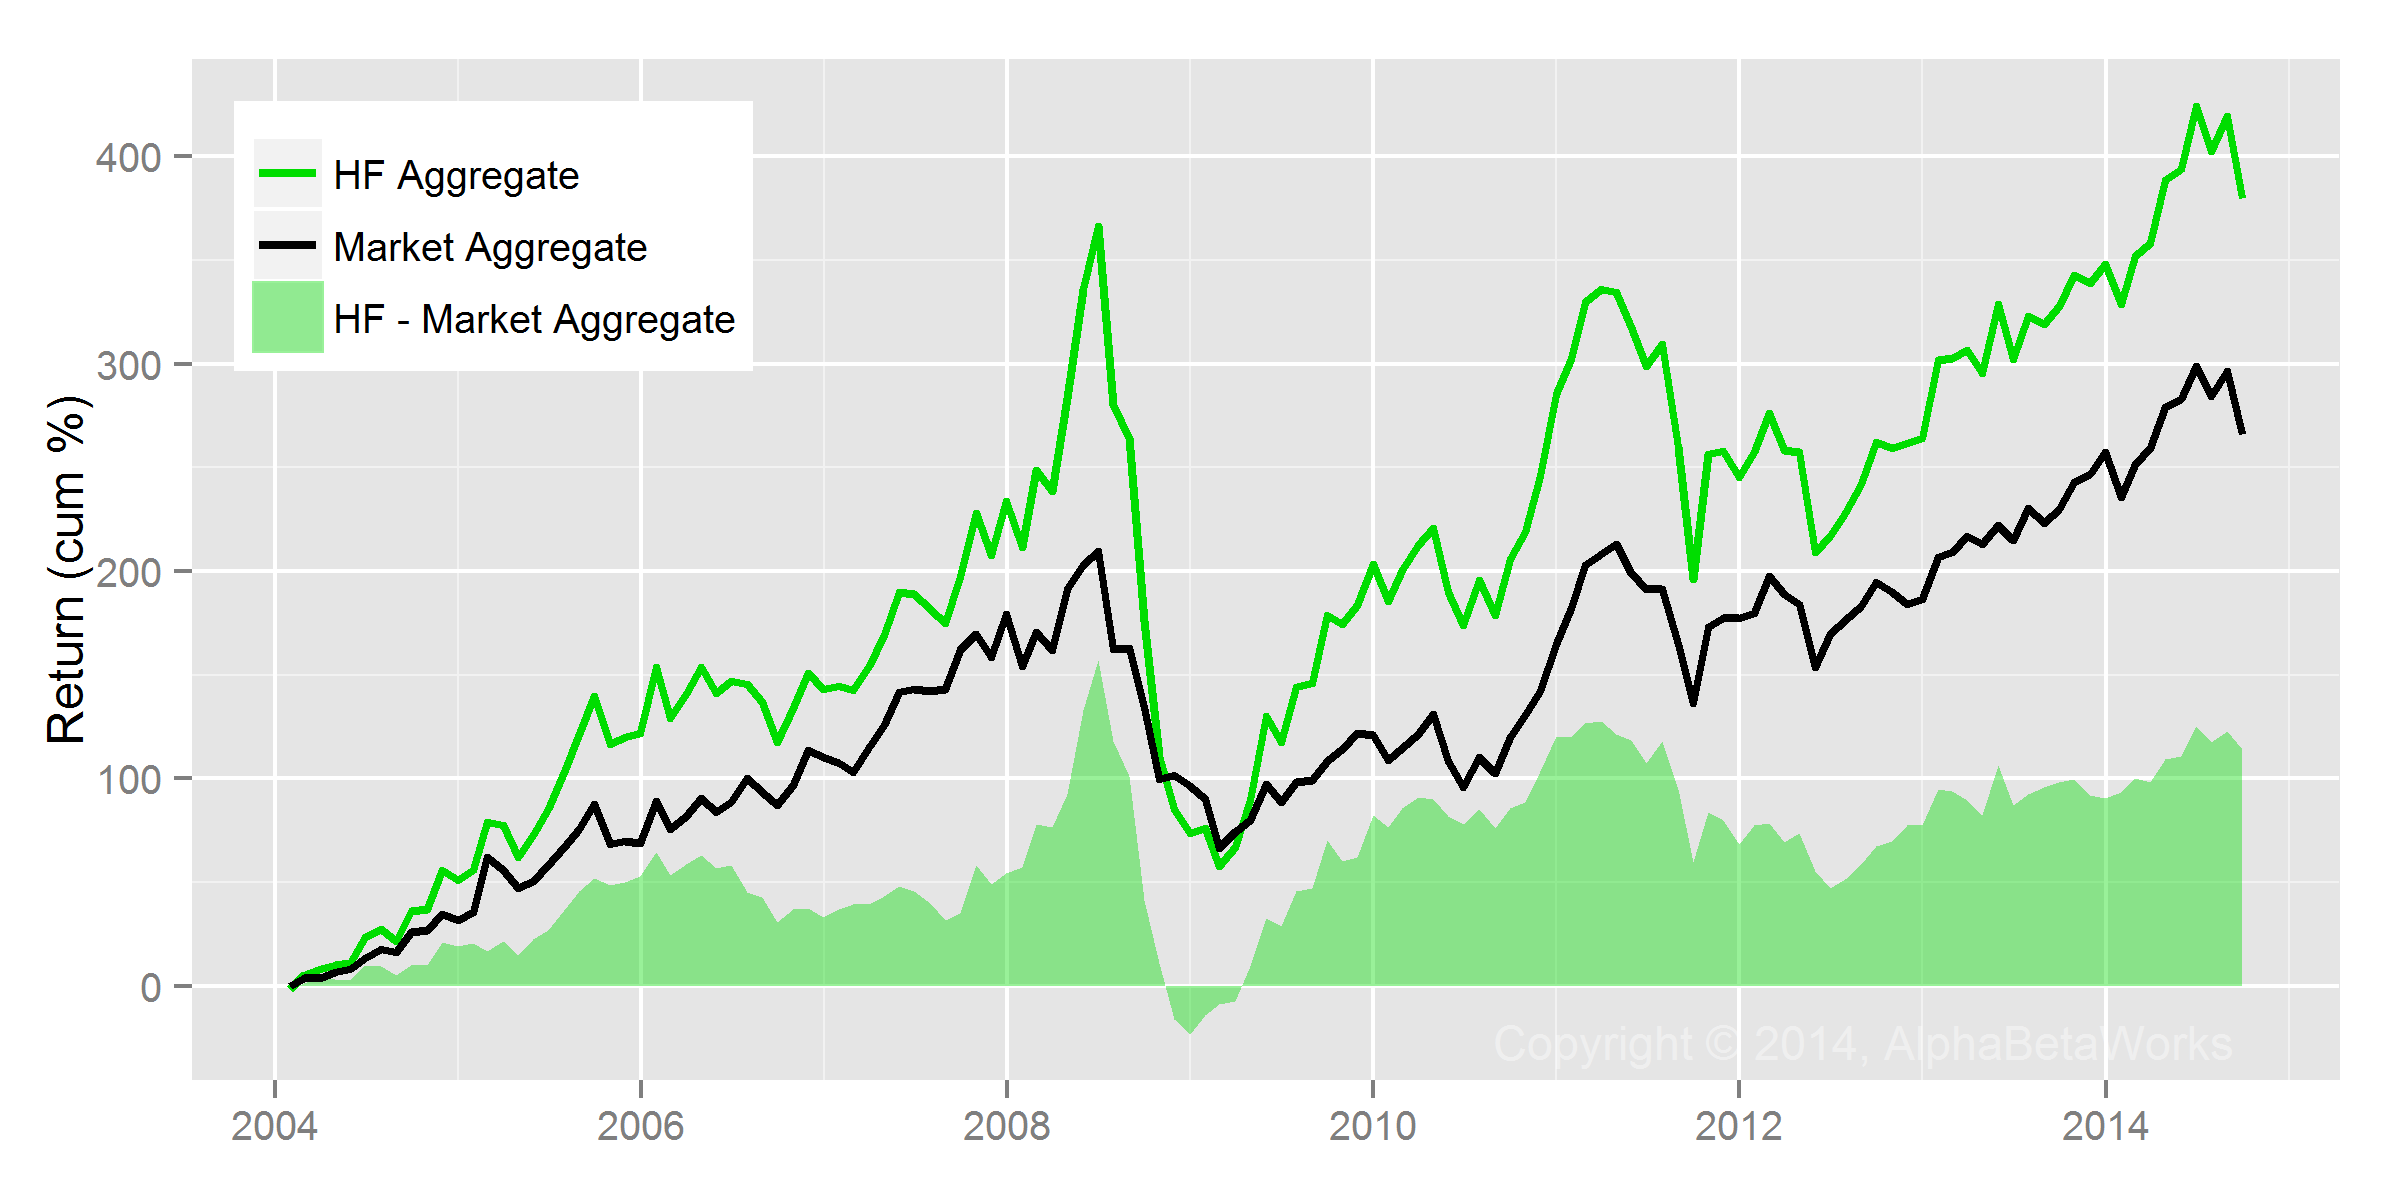
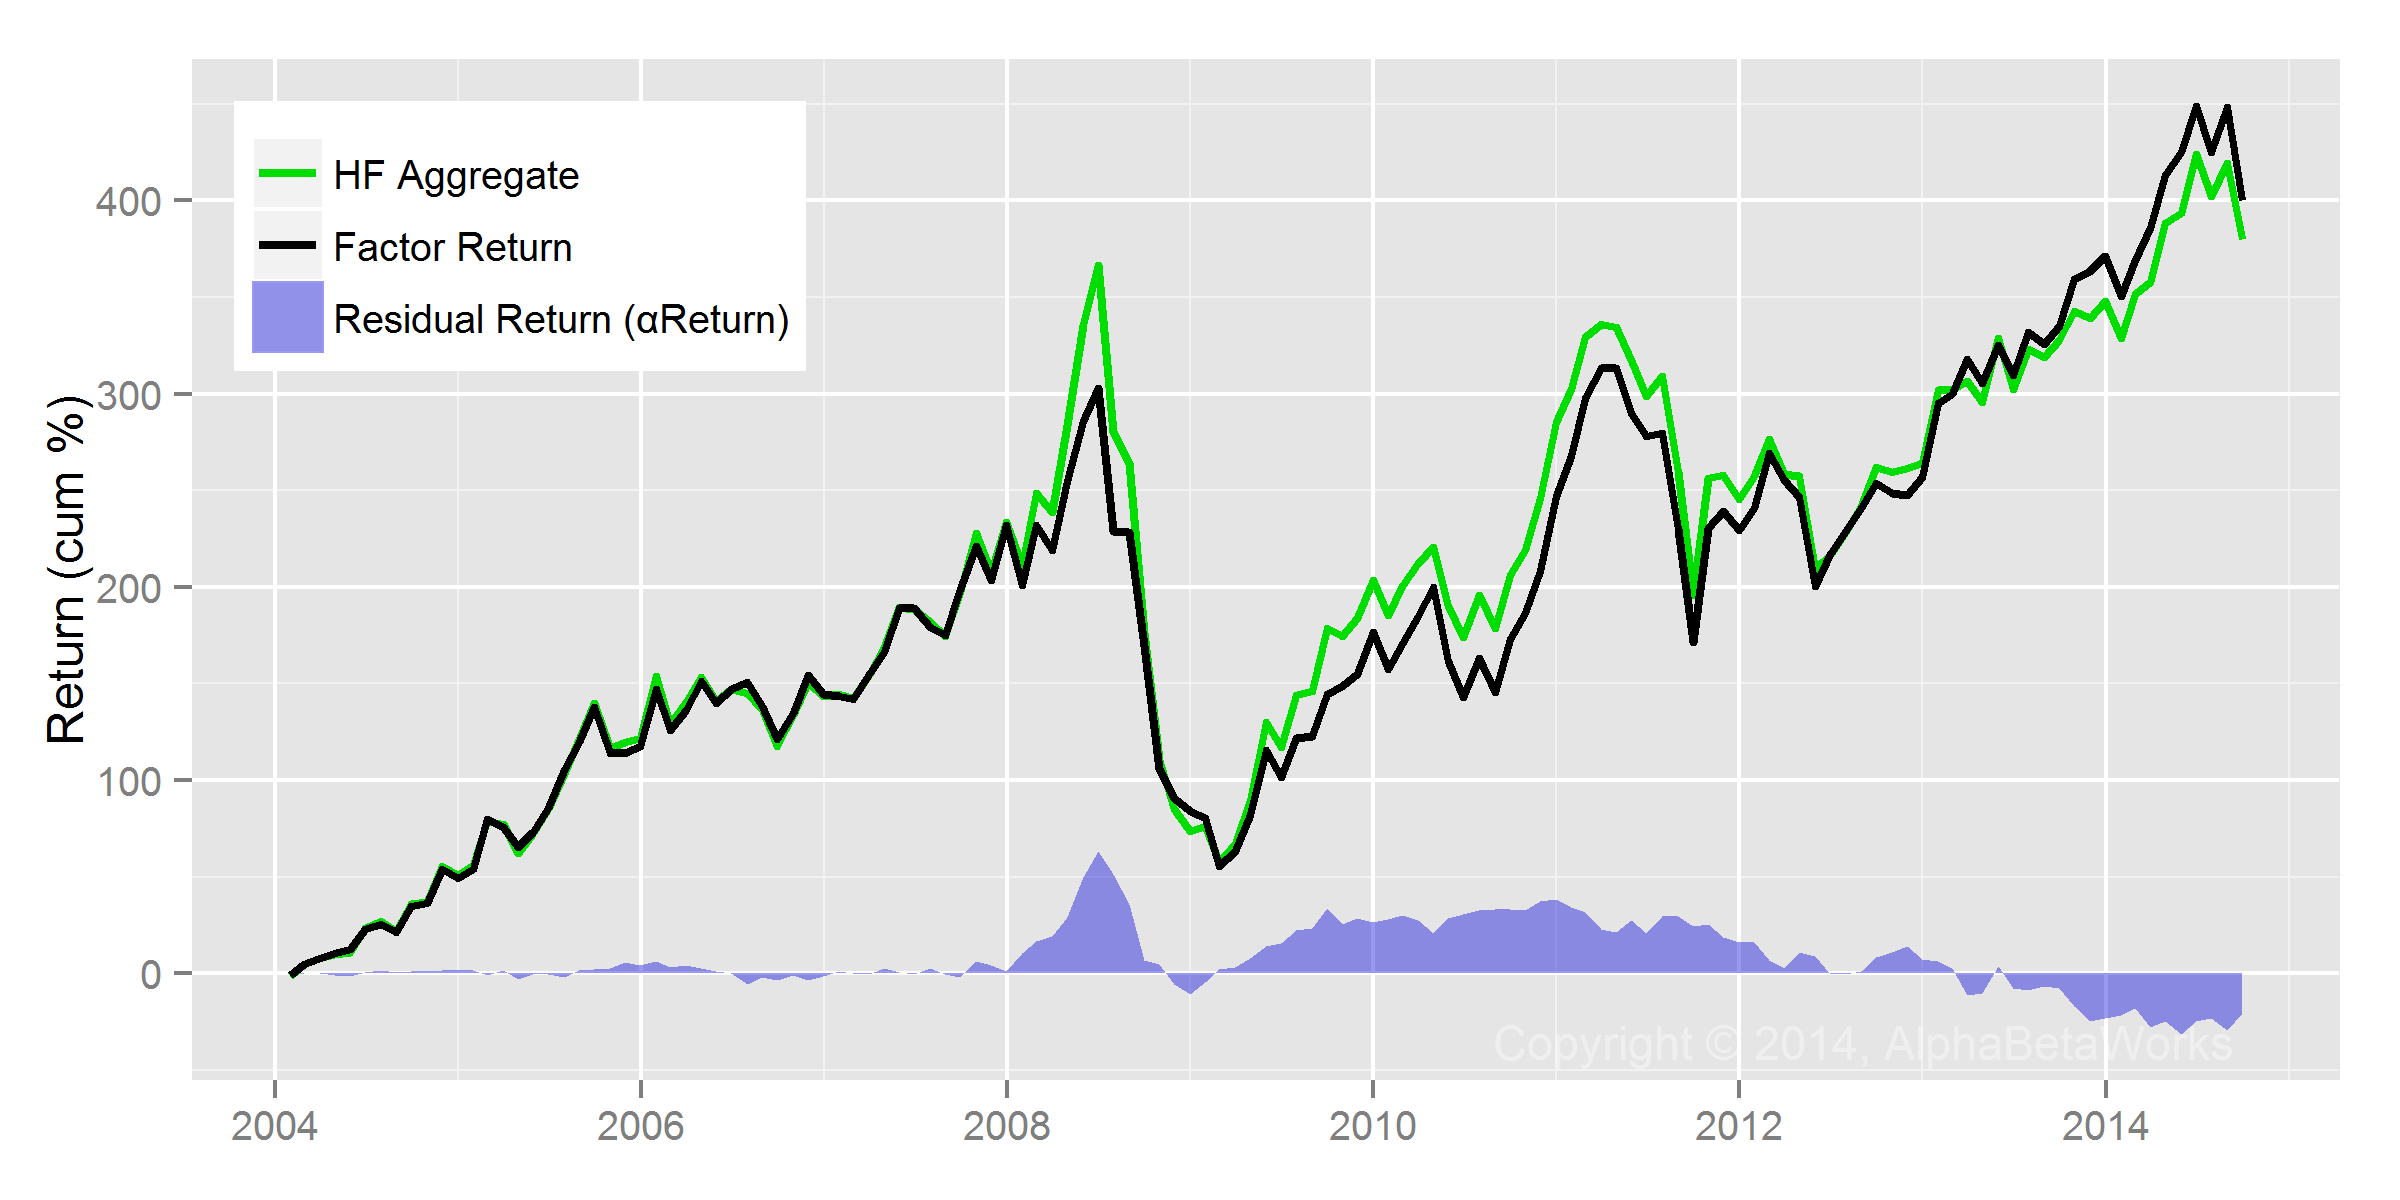
Risk-adjusted return from security selection isolates managers’ stock picking performance and identifies skill. AlphaBetaWorks defines αReturn as a metric of security selection performance – the estimated annual percentage return a fund would have generated in a flat market. This is also the outperformance relative to a passive portfolio with the same market (factor, systematic) risk.

The hedge fund industry has a poor record in the Energy Sector. Over the past 10 years, investors would have made approximately 20% more holding an ETF portfolio with similar market (factor) risk. If markets had been flat for the past 10 years, the average hedge fund long energy portfolio would have declined by approximately 20%.

Over the past three years, the peer group of all medium turnover hedge funds lost approximately 12% picking long energy stocks. On average, if the funds had simply invested in a portfolio of ETFs with the same risk, they would have made 12% more on their energy book. Half of these losses came in 2014:

Jan Feb Mar Apr May Jun Jul Aug Sep Oct Nov Dec Year
2012 -1.08 -0.29 -0.14 0.48 -0.15 -0.28 -0.54 -0.16 0.44 0.10 -0.08 -0.38 -2.06
2013 -0.63 0.12 0.35 -0.74 -0.33 -0.75 0.14 -0.45 -0.32 -0.58 -0.26 0.18 -3.22
2014 0.54 -0.89 -0.23 0.64 -0.90 -0.35 -0.74 -0.01 -1.34 -1.58 -0.45 -1.42 -6.55
2015 -0.77 -0.77

In the following chart we compare the energy αReturns of the top stock pickers to the returns of the group. The top stock pickers’ energy books made 20-80% more than they would have passively:

Chart of the risk-adjusted return from long energy sector security selection of the hedge funds with top performance in the sector

Energy Sector Return from Long Security Selection of the Top Energy Hedge Funds

Fund Energy Sector Security Selection αReturn
Long Positions
Dalton Investments LLC 79.00
Icahn Associates Corp. 47.31
Basswood Capital Management LLC 37.14
Chilton Investment Co. LLC 27.92
Horizon Asset Management LLC 16.74

Top Energy Hedge Funds’ Trades

Since stock picking skills are persistent and predictive, the trades and positions of the best and worst stock pickers are predictive of future stock performance. Investors should pay attention to the bets of the top managers.

We averaged the energy positions of these top performers. The following were their largest position increases and decreases during Q4 2014:

Chart of the average changes in energy sector positions of the top energy stock picking hedge funds

Energy Sector Position Changes of the Top Energy Hedge Funds

Symbol Name Position Change (%)
XOM Exxon Mobil Corporation 20.54
LINE Linn Energy, LLC 2.22
LNCO LinnCo. LLC 1.89
CVX Chevron Corporation 1.55
BBEP BreitBurn Energy Partners L.P. 1.38
SSE Seventy Seven Energy Inc -0.71
WPX WPX Energy, Inc. Class A -0.88
CNQ Canadian Natural Resources Limited -1.04
BHI Baker Hughes Incorporated -1.73
HAL Halliburton Company -6.68

Top Energy Hedge Funds’ Positions

At 12/31/2014, the top performers’ average portfolio consisted of the following positions:

Chart of the average energy sector positions of hedge funds with top energy sector security selection performance

Energy Sector Positions of the Top Energy Hedge Funds

Symbol Name Position (%)
XOM Exxon Mobil Corporation 22.16
HAL Halliburton Company 15.19
CHK Chesapeake Energy Corporation 13.86
CLR Continental Resources, Inc. 7.17
TLM Talisman Energy Inc. 6.51
PARR Par Petroleum Corporation 4.08
SLB Schlumberger NV 2.74
EOG EOG Resources, Inc. 2.52
LINE Linn Energy, LLC 2.22
CVX Chevron Corporation 2.07

Conclusions

  • The hedge fund industry has a poor track record selecting long energy stocks. A typical fund would have done better investing passively, and outside investors would do well to short crowded picks in the sector.
  • Despite the poor industry performance, some funds do have excellent energy stock picking records. These records are persistent and predictive.
  • In recent months, the top energy funds have increased their XOM position and cut HAL. HAL remained a top bet, along with XOM and CHK.
The information herein is not represented or warranted to be accurate, correct, complete or timely.
Past performance is no guarantee of future results.
Copyright © 2012-2015, 
AlphaBetaWorks, a division of Alpha Beta Analytics, LLC. All rights reserved.
Content may not be republished without express written consent.

Hedge Fund Crowding Toll: January 2015

Several of our articles discussed the vulnerability of crowded hedge fund positions to volatilitymass liquidation, and losses. We illustrated specific blow-ups (SanDisk (SNDK) and eHealth (EHTH)), as well as sectors with persistently poor hedge fund performance (Oil and Gas Production and Miscellaneous Mining). However, we have not showed how representative these examples are. This piece illustrates the performance toll of hedge fund crowding in a single (especially damaging) month – January 2015.

Identifying Crowding

We analyze hedge fund holdings (HF Aggregate) relative to the market portfolio (Market Aggregate). HF Aggregate is position-weighted while Market Aggregate is capitalization-weighted. We follow the approach of our earlier articles on aggregate and sector-specific hedge fund crowding.

January 2015 Hedge Fund Crowding Toll

January 2015 is a convenient month to consider: Due to intra-month volatility, the market was approximately flat at several dates. Hence, relative performance at these points gives a good picture of risk-adjusted performance. Whereas Russell 3000 was down about 2.7%, the portfolio of equal-weighted crowded hedge fund longs (in red on the chart below) declined twice as much:

Chart of the January 2015 performance of crowded long hedge fund bets

January 2015 Performance of Crowded Hedge Fund Long Bets

The crowded hedge fund longs in the above chart consist of HF Aggregate’s illiquid long bets relative to the Market Aggregate. Illiquid longs are overweight exposures of HF Aggregate valued at over 10 days of trading volume. We have discussed earlier that illiquidity is a key source of crowding risk since funds have difficulty exiting these positions. The specific 10 day limit was chosen arbitrarily. Below we show that results are consistent across a broad range of liquidity limits. The portfolio was constructed using AlphaBetaWorks’ Q3 2014 hedge fund crowding dataset, available to subscribers in late November.

Crowded hedge fund shorts are defined similarly: They consist of illiquid underweights relative to the Market Aggregate valued at over 10 days of trading volume. Crowded shorts (in green on the chart below) slightly outperformed the market in January:

Chart of he January 2015 performance of the crowded hedge fund long and short bets

January 2015 Performance of Crowded Hedge Fund Long and Short Bets

The performance of crowded hedge fund bets was roughly proportional to their crowding and liquidity. In the following chart, each line represents the performance of crowded hedge fund bets with a given level of crowding. Crowded and illiquid longs sized at 100 days of volume (red), underperformed crowded longs sized at 50 days (orange), etc. Meanwhile, illiquid shors (in shades of green) outperformed dramatically:

Chart of the January 2015 performance of crowded hedge fund bets as a function of liquidity

January 2015 Crowded Hedge Fund Bet Performance and Liquidity

In general, the larger and more illiquid a crowded hedge fund long bet was, the worse it fared. Even when a positive catalyst ought to lift a crowded long, impatient hedge fund holders may sell on the news, muting any upside. On the other hand, even when a negative catalyst ought to sink a crowded short, managers may buy on the news, muting any downside.

The damage covered a variety of industries and company sizes. Some of the notable losses in the crowded and illiquid long group were the following:

HF Aggregate Exposure

Symbol Name Value ($ mil) Liquidity (days) Performance (%)
NOR Noranda Aluminum Holding Corporation 103.80 40.19 -16.68
NMIH NMI Holdings, Inc. Class A 127.93 43.41 -16.71
AGYS Agilysys, Inc. 100.22 114.63 -18.42
RP RealPage, Inc. 112.04 10.96 -18.73
LPG Dorian LPG Ltd. 107.44 28.71 -19.01
TWI Titan International, Inc. 125.13 16.29 -19.09
HTZ Hertz Global Holdings, Inc. 2778.20 10.77 -20.46
DPM DCP Midstream Partners, LP 377.28 15.00 -20.85
HLF Herbalife Ltd. 982.00 10.42 -22.16
THRX Theravance, Inc. 321.32 19.18 -24.92
SALT Scorpio Bulkers, Inc. 139.66 32.25 -25.35
SXC SunCoke Energy, Inc. 161.15 16.09 -25.73
CACQ Caesars Acquisition Co. Class A 110.62 83.10 -29.25
SD SandRidge Energy, Inc. 317.85 11.38 -29.83
YRCW YRC Worldwide Inc. 280.23 15.99 -36.12
CZR Caesars Entertainment Corporation 245.84 10.74 -39.47
LE Lands’ End, Inc. 321.92 12.10 -46.47
ASPS Altisource Portfolio Solutions S.A. 245.55 10.77 -52.17
ADES Advanced Emissions Solutions, Inc. 107.92 41.21 -77.55
OCN Ocwen Financial Corporation 910.00 12.37 -87.76

Some of the notable gains in the crowded short group were the following:

HF Aggregate Exposure

Symbol Name Value ($ mil) Liquidity (days) Performance (%)
SBUX Starbucks Corporation -766.74 -2.02 6.78
KR Kroger Co. -390.36 -1.81 6.80
SPG Simon Property Group, Inc. -508.85 -1.90 6.83
LUV Southwest Airlines Co. -767.17 -1.88 6.89
NS NuStar Energy L.P. -141.06 -3.79 6.97
PRXL PAREXEL International Corporation -277.74 -6.47 7.09
BAH Booz Allen Hamilton Holding Corporation Class A -140.18 -7.13 7.60
ICLR ICON Plc -281.30 -9.46 8.28
GILD Gilead Sciences, Inc. -2122.35 -1.29 9.56
BA Boeing Company -2372.83 -4.29 9.78
NEU NewMarket Corporation -178.11 -10.24 10.35
PBYI Puma Biotechnology, Inc. -109.17 -1.57 10.75
ATK Alliant Techsystems Inc. -108.27 -2.90 11.02
TMUS T-Mobile US, Inc. -149.48 -1.11 11.13
BIIB Biogen Idec Inc. -1221.11 -2.01 12.86
SLXP Salix Pharmaceuticals, Ltd. -695.73 -2.19 14.75
PCRX Pacira Pharmaceuticals, Inc. -249.52 -4.43 16.82
CLR Continental Resources, Inc. -535.76 -3.54 17.56
HAR Harman International Industries, Incorporated -111.76 -1.31 19.27
ICPT Intercept Pharmaceuticals, Inc. -378.15 -4.27 25.29

January 2015 was an especially costly month for crowded hedge fund ideas, but it illustrated a broad and consistent effect. Crowding takes a heavy toll on performance and warrants close scrutiny from portfolio managers, analysts, and allocators.

The information herein is not represented or warranted to be accurate, correct, complete or timely.
Past performance is no guarantee of future results.
Copyright © 2012-2015, AlphaBetaWorks, a division of Alpha Beta Analytics, LLC. All rights reserved.
Content may not be republished without express written consent.

Hedge Fund Crowding Costs – eHealth

EHTH (eHealth, Inc.), an Internet health insurance agency, was down over 50% following disappointing revenue and EPS guidance. The events were yet another example of the mass sell-offs in crowded hedge fund bets after disappointing news. This once again demonstrates that investors must monitor their portfolios for crowding.

EHTH was not the largest stock-specific hedge fund insurance sector bet, but it was one of the least liquid. The aggregate crowded position constituted about nine days’ trading volume. As funds struggled to exit, more shares traded in one day than in the prior week, knocking the price down 54%. We illustrate how investors aware of this crowding could have avoided the losses.

To explore crowding we analyze hedge fund Life and Health Insurance Sector holdings (HF Sector Aggregate) relative to the Sector Market Portfolio (Sector Aggregate). HF Sector Aggregate is position-weighted while Sector Aggregate is capitalization-weighted. This follows the approach of our earlier articles on aggregate and sector-specific hedge fund crowding. Crowded positions are vulnerable to volatility, mass liquidation, and losses; they persistently underperform in some sectors.

Hedge Fund Life and Health Insurance Performance

The figure below plots historical return of HF Life and Health Insurance Aggregate. Factor return is due to systematic (market) risk. Blue area represents positive and gray area represents negative risk-adjusted returns from security selection (αReturn). Crowded bets underperformed the factor portfolio by over 35%:

Chart of the historical factor and idiosyncratic performance of the Hedge Fund Life and Health Insurance Sector Aggregate

Hedge Fund Life and Health Insurance Sector Aggregate Historical Performance

Hedge Fund Life and Health Insurance Risk-Adjusted Performance

The risk-adjusted return from security selection (αReturn) of HF Sector Aggregate is the return it would have generated if markets were flat – all market effects on performance have been eliminated. This is the idiosyncratic performance of the crowded portfolio. Crowded bets in this sector are especially dangerous, given their propensity to disappoint:

Chart of the historical security selection (stock picking) performance of the Hedge Fund Life and Health Insurance Sector Aggregate

Hedge Fund Life and Health Insurance Sector Aggregate Historical Security Selection Performance

Crowded Hedge Fund Life and Health Insurance Ideas

The following stocks contributed most to the relative residual (security-specific) risk of the HF Sector Aggregate as of Q3 2014. Blue bars represent long (overweight) exposures relative to Sector Aggregate. White bars represent short (underweight) exposures. Bar height represents contribution to relative stock-specific risk:

Chart of the contribution to the residual (stock-specific) risk of the crowded hedge fund Life and Health Insurance Sector bets

Crowded Hedge Fund Life and Health Insurance Sector Bets

The following table contains detailed data on these crowded ideas:

Exposure (%) Net Exposure Share of Risk (%)
HF Sector Aggr. Sector Aggr. % $mil Days of Trading
VOYA Voya Financial, Inc. 29.79 5.83 23.96 375.4 4.5 39.08
UAM Universal American Corp. 8.73 0.39 8.34 130.7 123.5 18.76
LNC Lincoln National Corporation 23.20 8.45 14.75 231.2 1.9 11.48
EHTH eHealth, Inc. 3.55 0.26 3.29 51.6 8.9 8.98
AFL Aflac Incorporated 1.05 15.94 -14.88 -233.2 -1.6 8.52
MET MetLife, Inc. 12.56 36.31 -23.75 -372.1 -1.1 8.15
GNW Genworth Financial, Inc. Class A 5.55 3.93 1.62 25.4 0.3 1.04
UNM Unum Group 0.92 5.29 -4.37 -68.5 -1.0 0.97
PNX Phoenix Companies, Inc. 1.59 0.19 1.39 21.9 9.5 0.87
SYA Symetra Financial Corporation 3.75 1.63 2.12 33.1 3.6 0.42
RGA Reinsurance Group of America, Incorporat 0.55 3.32 -2.76 -43.3 -1.4 0.28
TMK Torchmark Corporation 0.00 4.13 -4.13 -64.7 -1.5 0.27
ANAT American National Insurance Company 0.00 1.82 -1.82 -28.6 -17.4 0.27
SFG StanCorp Financial Group, Inc. 0.00 1.64 -1.64 -25.6 -1.8 0.24
PRI Primerica, Inc. 0.00 1.58 -1.58 -24.8 -1.7 0.16
EIG Employers Holdings, Inc. 1.06 0.37 0.69 10.8 4.1 0.10
AEL American Equity Investment Life Holding 0.13 1.03 -0.91 -14.2 -0.7 0.09
PL Protective Life Corporation 2.41 3.32 -0.91 -14.2 -0.3 0.08
CNO CNO Financial Group, Inc. 3.11 2.13 0.98 15.4 0.6 0.07
IHC Independence Holding Company 0.60 0.14 0.46 7.2 42.1 0.05
Other Positions 0.03 0.11
Total 100.00

The table above shows that, while EHTH was neither the highest contributor to risk nor the most illiquid, it was one of the top bets in each category. When the bad news came, its value halved. VOYA, UAM, and LNC, the other large and illiquid bets, are also at risk. Even when a positive catalyst arrives, impatient hedge fund holders may sell on the news, muting any upside. Whether or not investors choose to steer clear of crowded names, they must monitor them. With proper data, this attention to crowding can prevent “unexpected” volatility.

Conclusion

eHealth illustrates the vulnerability of crowded and illiquid positions to disorderly liquidation. eHealth was especially dangerous, given the tendency of crowded hedge fund life and health insurance ideas to disappoint. Investors armed with hedge fund crowding insights could have avoided these losses.

The information herein is not represented or warranted to be accurate, correct, complete or timely.
Past performance is no guarantee of future results.
Copyright © 2012-2015, AlphaBetaWorks, a division of Alpha Beta Analytics, LLC. All rights reserved.
Content may not be republished without express written consent.

Hedge Fund Crowding Costs – SanDisk

SanDisk (SNDK) was down 14% following a disappointing pre-announcement. This is a common occurrence for crowded ideas: SanDisk is the most crowded hedge fund bet in its sector, and crowded hedge fund Electronic Components picks tend to do poorly. These events illustrate crowding costs, particularly in the areas where hedge funds display a persistent lack of skill.

This piece analyzes hedge fund Electronic Components sector holdings (HF Sector Aggregate) relative to the sector market portfolio (Sector Aggregate). HF Sector Aggregate is position-weighted while Sector Aggregate is capitalization-weighted. We follow the approach of our earlier articles on aggregate and sector-specific hedge fund crowding. Crowded positions are vulnerable to volatility, mass liquidation, and losses. In some sectors crowded positions persistently underperform.

Hedge Fund Electronic Components Performance

The figure below plots historical return of HF Sector Aggregate. Factor return is due to systematic (market) risk. Blue area represents positive and gray area represents negative risk-adjusted returns from security selection (αReturn):

Chart of the components of Hedge Fund Electronic Components Sector Aggregate historical performance

Hedge Fund Electronic Components Sector Aggregate Historical Performance

Hedge Fund Electronic Components Risk-Adjusted Performance

The risk-adjusted return from security selection (αReturn) of HF Sector Aggregate is the return it would have generated if markets were flat. This is the idiosyncratic performance of the crowded portfolio. Adjusted for market returns, crowded bets have lost 24% since 2004:

Chart of the risk-adjusted return from security selection of the Hedge Fund Electronic Components Sector Aggregate

Hedge Fund Electronic Components Sector Aggregate Historical Risk-Adjusted Performance

Crowded Hedge Fund Electronic Components Bets

The following stocks contributed most to the relative residual (security-specific) risk of the HF Sector Aggregate as of 2014-09-30. Blue bars represent long (overweight) exposures relative to Sector Aggregate. White bars represent short (underweight) exposures. Bar height represents contribution to relative stock-specific risk:

Chart of the recent crowded stock-specific (idiosyncratic) Hedge Fund Electronic Components Sector bets

Crowded Hedge Fund Electronic Components Sector Bets

The following table contains detailed data on these crowded bets:

Exposure (%) Net Exposure Share of Risk (%)
HF Sector Aggr. Sector Aggr. % $mil Days of Trading
SNDK SanDisk Corporation 40.46 16.60 23.87 584.0 1.7 43.86
FLEX Flextronics International Ltd. 35.31 4.59 30.73 751.9 13.7 37.92
GLW Corning Incorporated 2.68 18.87 -16.19 -396.1 -2.0 5.73
TEL TE Connectivity Ltd. 0.02 17.10 -17.07 -417.9 -3.0 4.84
FSLR First Solar, Inc. 1.38 4.98 -3.60 -88.1 -0.7 3.00
APH Amphenol Corporation Class A 1.31 11.86 -10.55 -258.3 -3.4 1.30
CREE Cree, Inc. 0.82 3.70 -2.88 -70.5 -0.8 1.02
KN Knowles Corp. 3.51 1.70 1.81 44.3 1.1 0.58
PLUG Plug Power Inc. 0.03 0.58 -0.55 -13.5 -0.6 0.47
SANM Sanmina-SCI Corporation 0.00 1.30 -1.30 -31.9 -1.9 0.23
OLED Universal Display Corporation 0.27 1.15 -0.88 -21.5 -1.3 0.17
JBL Jabil Circuit, Inc. 1.67 3.05 -1.38 -33.7 -0.5 0.12
RSYS RadiSys Corporation 0.75 0.07 0.67 16.5 60.7 0.11
IMI Intermolecular, Inc. 0.91 0.08 0.82 20.1 145.2 0.10
RELL Richardson Electronics, Ltd. 1.62 0.09 1.53 37.5 162.9 0.08
CODE Spansion Inc. Class A 0.21 1.05 -0.84 -20.7 -0.3 0.06
PLXS Plexus Corp. 0.00 0.94 -0.94 -23.0 -2.9 0.05
AVX AVX Corporation 0.00 1.69 -1.69 -41.3 -13.2 0.04
VICR Vicor Corporation 0.70 0.19 0.51 12.5 9.9 0.04
FN Fabrinet 0.00 0.39 -0.39 -9.5 -2.8 0.04
Other Positions 0.19 0.23
Total 100.00

Conclusion

SanDisk illustrates the vulnerability to crowded names to mass liquidation by impatient investors. In general, crowded Electronic Component stocks tend to disappoint and hedge funds do even worse in other sectors.

Instead of blindly following hedge funds into popular technology names, investors should be wary of these ideas. Even excellent managers are seldom skilled in all areas and tend to generate the bulk of their active returns from a few specific skills.

The information herein is not represented or warranted to be accurate, correct, complete or timely.
Past performance is no guarantee of future results.
Copyright © 2012-2015, AlphaBetaWorks, a division of Alpha Beta Analytics, LLC. All rights reserved.
Content may not be republished without express written consent.

Hedge Fund Internet Software Crowding

Hedge funds tend to pile into the same few stocks. In most sectors these crowded bets underperform. In previous articles we discussed the crowding of hedge fund energy as well as exploration and production bets. Internet software stocks show similar underperformance.

Hedge Fund Internet Software Aggregate

If markets were flat since 2004, the aggregate position-weighted hedge fund internet software portfolio (HF Aggregate) would have lost 25%. This is HF Aggregate’s risk adjust return from security selection (αReturn):

Chart of the cumulative risk-adjusted returns from security selection of the HF Internet Software Aggregate

Hedge Fund Internet Software Aggregate’s Residual Returns (αReturns)

Given the compounding of αReturns and internet software sector returns, the cumulative underperformance is even larger: Since 2004 HF Aggregate returned 200%. A portfolio with the same systematic risk as HF Aggregate (Factor Portfolio) returned 300%. Investors in crowded bets missed out on 100% in gains:

Chart of the cumulative total and factor (systematic) returns of the HF Internet Software Aggregate

Hedge Fund Internet Software Aggregate’s Total and Factor Returns

Hedge Fund Internet Software Crowding History

The following video shows the history of crowded hedge fund internet software bets. These are the stocks behind the record:

Current Hedge Fund Internet Software Crowding

The following are the currently crowded hedge fund internet software bets. Just two (long EQIX, short/underweight GOOGL) are responsible for over three quarters of the risk of HF Internet Software Aggregate:

Position (%)
Symbol Name HF Aggregate Market Aggregate Relative Share of Risk (%)
EQIX Equinix, Inc. 23.77 1.63 22.14 53.73
GOOGL Google Inc. Class A 10.51 44.39 -33.88 25.65
TWTR Twitter, Inc. 0.49 3.46 -2.97 4.65
ZNGA Zynga Inc. Class A 2.89 0.26 2.63 3.52
RBDC RBID.com, Inc. 0.00 0.17 -0.17 2.07
P Pandora Media, Inc. 2.41 0.53 1.88 1.87
RAX Rackspace Hosting, Inc. 3.13 0.86 2.27 1.76
SFLY Shutterfly, Inc. 2.32 0.22 2.10 1.38
WBMD WebMD Health Corp. 1.84 0.18 1.66 0.93
NERO NeuroMama Ltd. 0.00 0.74 -0.74 0.75
AKAM Akamai Technologies, Inc. 3.04 1.50 1.54 0.61
TRLA Trulia, Inc. 1.01 0.25 0.76 0.36
IACI IAC/InterActiveCorp. 2.83 0.66 2.16 0.34
YNDX Yandex NV Class A 2.32 0.81 1.51 0.33
MSTR MicroStrategy Incorporated Class A 1.54 0.20 1.34 0.31
LNKD LinkedIn Corporation Class A 2.20 3.20 -1.00 0.27
FB Facebook, Inc. Class A 21.76 22.54 -0.78 0.21
MELI MercadoLibre SA 0.00 0.81 -0.81 0.15
KING King Digital Entertainment Plc 1.05 0.63 0.42 0.13
ECOM Channeladvisor Corporation 0.42 0.06 0.37 0.11

The information herein is not represented or warranted to be accurate, correct, complete or timely.
Past performance is no guarantee of future results.
Copyright © 2012-2014, AlphaBetaWorks, a division of Alpha Beta Analytics, LLC. All rights reserved.
Content may not be republished without express written consent.

Hedge Fund E&P Crowding History

As we have discussed in earlier articles on hedge fund energy as well as exploration and production crowding, funds pile into the same few stocks. Over time these crowded stocks tend to underperform.

The following video shows the most crowded hedge fund E&P stocks over history, and their historical risk-adjusted performance:

The information herein is not represented or warranted to be accurate, correct, complete or timely.
Past performance is no guarantee of future results.
Copyright © 2012-2014, 
AlphaBetaWorks, a division of Alpha Beta Analytics, LLC. All rights reserved.
Content may not be republished without express written consent.

Hedge Fund Crowding Costs – Energy

In recent articles we discussed shared long bets among U.S. hedge funds – a phenomenon called “crowding” – without quantifying its consequences. Crowding is costly to investors, fund managers, and allocators. A prime example of this is the Energy Sector:

  • Over the past 10 years the aggregate hedge fund long energy portfolio (HF Energy Aggregate) delivered negative risk-adjusted returns.
  • Since the energy cycle peaked in mid-2008, HF Energy Aggregate took more risk than the market energy portfolio (Market Energy Aggregate), yet it underperformed.
  • Since mid-2008, HF Energy Aggregate has lost 20% on a risk-adjusted basis.

Hedge Fund Energy Crowding

Our previous article discussed hedge fund (HF) energy herding, We created an aggregate position-weighted portfolio (HF Energy Aggregate) consisting of all long energy equity positions reported by over 400 U.S. hedge funds with medium to low turnover. We then evaluated HF Energy Aggregate’s risk relative to the capitalization-weighted portfolio of energy equities (Market Energy Aggregate) using AlphaBetaWorks’ Statistical Equity Risk Model. The exercise revealed factor (systematic/market) and residual (idiosyncratic/security-specific) crowding.

We mentioned that consensus hedge fund long energy bets tend to disappoint and carry higher risk, but we did not quantify these costs.

Crowded Energy Stocks Underperform

Hedge fund crowding hurts performance. HF Energy Aggregate had poor returns following the peak of the last energy cycle in 2008, even without taking into account its higher risk:

Chart of the historical cumulative returns of Hedge Fund Energy Aggregate  and Market Energy Aggregate

Historical Return for Hedge Fund Energy Aggregate vs. Market Energy Aggregate

The spectacular relative performance of HF Energy Aggregate during the commodity boom and the disastrous relative performance in the subsequent commodity crash suggest herding into higher-risk stocks. This is consistent with the aggregate systematic crowding of hedge funds towards higher market beta.

Crowded Energy Stocks Are Riskier

HF Energy Aggregate tends to carry approximately 20% more market exposure than Market Energy Aggregate:

Chart of the exposure of Hedge Fund Energy Aggregate’ to most significant risk factors

Hedge Fund Energy Aggregate’s Exposure to Significant Risk Factors

Crowded Energy Stocks Have Poor Risk-Adjusted Returns

Due to the higher risk of HF Energy Aggregate, its residual return (risk-adjusted performance due to security selection) is even worse. Investors would have made approximately 20% more over the past 10 years holding an ETF portfolio with similar factor risk (factor portfolio):

Chart of the historical cumulative returns, factor returns, and risk-adjusted returns from security selection of  Hedge Fund Energy Aggregate

Historical Hedge Fund Energy Aggregate Factor and Residual Returns

Investors would have also made approximately 20% more since the mid-2008 energy cycle peak with this factor portfolio:

Chart of the historical cumulative returns, factor returns, and risk-adjusted returns from security selection of Hedge Fund Energy Aggregate  since the 2008 energy cycle peak

Historical Hedge Fund Energy Aggregate Factor and Residual Returns since Cycle Peak

Summary

  • Hedge Fund Energy Aggregate tends to have higher risk than Market Energy Aggregate.
  • Crowded Hedge Fund Energy stocks tend to generate negative risk-adjusted returns.
  • Crowded Hedge Fund Energy stocks tend to outperform in a boom and underperform in a bust: Since mid-2008 energy cycle peak, HF Energy Aggregate underperformed nominally and lost 20% on a risk-adjusted basis.
The information herein is not represented or warranted to be accurate, correct, complete or timely.
Past performance is no guarantee of future results.
Copyright © 2012-2014, 
AlphaBetaWorks, a division of Alpha Beta Analytics, LLC. All rights reserved.
Content may not be republished without express written consent.

Pure Sector Factors and the Energy Cycle

Separating the Signal from the Noise in the Energy Sector

In an article introducing pure sector factors, we illustrated how market noise obscures relationships among individual sectors, concealing industry-specific performance. As a result, most investors are oblivious of the underlying secular trends and are frequently blindsided by them. This obliviousness can be costly. For example, investors aware of the pure oil and gas producer performance would have been forewarned of the recent energy sector selloff.

Oil and Gas Producer Sector Performance

The selloff in oil and gas producer equities in September and October of 2014 caught some by surprise. It should not have.

A superficial analysis of oil and gas producers’ performance would simply consider historical returns. The sector roughly tracked the broad market, increasing over 200% since 2009 lows:

Chart of the cumulative return of the oil and gas producer sector index

Oil and Gas Producers Sector Index Return

This simple chart conceals powerful secular trends. Obscured by market noise, the underlying energy sector cycle is concealed.

Oil and Gas Producer Pure Sector Factor

We reveal the underlying trends by removing market and macroeconomic effects from security returns and calculating the performance of pure oil and gas producer sector factor. Contrary to the chart above, the sector’s pure performance since 2009 lows was -20%:

Chart of the cumulative historical return  of the oil and gas producers pure sector factor

Oil and Gas Producers Pure Sector Factor Return

The pure sector factor tracks the energy cycle, revealing a story of broad economic and geopolitical trends:

  • Overcapacity and crash of the late-90s;
  • Supply shortages, emerging-market commodity boom, and unconventional revolution of 2000-2008;
  • Low-cost production growth, over-investment, and a return to overcapacity post-2008.

Since the energy cycle peaked in 2008, the oil and gas producer sector has lagged the market, on a risk-adjusted basis, by over 35%. Investors in the sector have missed out on over 35% in gains. This deterioration has been concealed by the broad market rally.

Deterioration in sector-specific performance began around the same time as rapid growth in natural gas supply from Haynesville and Marcellus and oil supply from Bakken. The pure return of producer equities, free from market noise, has been negative even as oil prices advanced. Consequently, pure oil and gas producer performance has been a powerful leading indicator.

Oil and Gas Pipelines Pure Sector Factor

The flip-side of the growth in supply has been the shortage of pipeline capacity. The following are the pure returns for oil and gas pipelines, with market effects removed. This boom in pipelines is a direct consequence of the glut of hydrocarbon production evident in the pure producer performance:

Chart of the pure sector factor return for the oil and gas pipelines sector

Oil and Gas Pipelines Pure Sector Factor Return

Recent Pure Oil and Gas Producer Performance

The poor performance of oil and gas producers in October 2014 was a continuation of a long trend. When the broad market experienced hiccups, the underlying trends became evident:

Chart of the daily return of oil and gas producers pure sector factor

Oil and Gas Producers Pure Sector Factor Daily Return

Conclusions

  • By stripping away the effects of market and macroeconomic variables, we can calculate the returns of pure sector factors.
  • Pure oil and gas producer performance has been a powerful leading indicator of the energy sector selloff.
  • The energy cycle peaked in mid-2008 and producers have been in decline since.
  • Despite sector index return of over 200% since 2009 lows, sector investors missed out on 35% in returns since 2008 – pure sector performance was a decline of over 35%.
  • Failure to isolate pure sector factors left many energy investors complacent and ignorant of the underlying trends as the broad market advanced.


The information herein is not represented or warranted to be accurate, correct, complete or timely.
Past performance is no guarantee of future results.
Copyright © 2012-2014, AlphaBetaWorks, a division of Alpha Beta Analytics, LLC. All rights reserved.
Content may not be republished without express written consent.

Vanguard Wellington Fund (VWENX) – Market Timing

Vanguard Wellington Fund (VWENX) is an excellent market timer with a track record of increasing exposures to factors that subsequently generate larger-than-typical returns.

Over the past 10 years, the fund returned approximately 7% solely through varying its factor exposures. This compares to an approximately 4% market-timing loss for the average medium turnover U.S. equity mutual fund:

Chart of the historical return due to market timing of Vanguard Wellington Fund (VWENX)

Vanguard Wellington Fund (VWENX) Market Timing Return History

VWENX’s 3-year marker timing return (βReturn3) is well ahead of the group:

Chart of the return distribution of market timing returns of medium turnover U.S. Mutual Funds

U.S. Mutual Fund Market Timing Return Distribution

Given the excellent market-timing performance, VWENX’s bets are worth watching.

Chart of the historical factor exposures of Vanguard Wellington Fund (VWENX)

Vanguard Wellington Fund (VWENX) Historical Factor Exposures

  • The fund’s exposures to finance sector, health sector, and large-caps are larger than typical.
  • The fund’s exposures to consumer sector, energy sector, and utilities are smaller than typical.

Icahn’s Technology Security Selection

Should Investors Follow Icahn into Apple?

As we discussed in earlier articles, it is a mistake to treat all ideas of excellent managers with equal deference. Even great investors tend to be more skilled in some areas than in others. Carl Icahn is no exception.

Many investors follow the positions of Carl Icahn. His recent open letter to Apple’s CEO Tim Cook will cause some to follow Icahn into Apple. Doing so merely on the basis on Icahn’s involvement would be a mistake. While Icahn Associates generated spectacular long-term returns from security selection (stock-picking), the firm’s technology performance has been disappointing.

Icahn’s Overall Security Selection

The risk-adjusted return of Icahn Associates’ long equity portfolio, estimated from the firm’s 13F filings, is indeed high. We estimate that over the past 10 years the firm generated over 150% cumulative return from long equity security selection. We call this αReturn – the estimated annual percentage return a fund would have generated in a flat market:

Chart of the security selection return of the long equity portfolio of Icahn Associates

Icahn Associates Security Selection Return – Long Equity Portfolio

While Icahn Associates’ long-term record is strong, the inconsistent αReturn is a concern.

Icahn’s Technology Security Selection

We focus on Icahn’s skill vis-à-vis the technology sector only. In the future articles we will explore the sources of Icahn’s risk-adjusted returns in greater depth.

Icahn Associates’ long technology equity positions have lost approximately 60% on a risk-adjusted basis since 2004. The chart below shows the returns of Icahn’s technology portfolio relative to ETFs with the same market and technology factor exposures. Icahn’s picks have underperformed by 60%:

Chart of the security selection return of the technology long equity portfolio of Icahn Associates

Icahn Associates Security Selection Return – Long Technology Equity Portfolio

Technology stock picking cost the aggregate long equity portfolio approximately 4% over this period. If Icahn Associates had invested in a passive technology portfolio with matching systematic risk, the 10-year return would have been 4% higher.

Chart of the long equity security selection of the overall portfolio of Icahn Associates due to technology positions

Icahn Associates Technology Sector Security Selection Return Contribution – Long Equity Portfolio

It turns out that technology is one of Icahn’s areas of weakness. While AAPL may be an excellent investment on its own merits, investors should not make their decisions based on Icahn’s involvement. If anything, it’s a negative indicator.

The information herein is not represented or warranted to be accurate, correct, complete or timely.
Past performance is no guarantee of future results.
Copyright © 2012-2014, AlphaBetaWorks, a division of Alpha Beta Analytics, LLC. All rights reserved.
Content may not be republished without express written consent.