
Equity market hedging techniques can be complex and their effectiveness hard to assess. In this piece we evaluate the effectiveness of several market hedging techniques by comparing them to the (idealized and unattainable) perfect market hedge. Specifically, we compare realized market correlations of hedged U.S. equity mutual fund portfolios to market correlations of random return series. Random return series are the ideal that would have been produced by perfect hedging of portfolios satisfying the random walk hypothesis. Whereas hedges that use a fixed 1 beta and hedges that use returns-based style analysis (RBSA) are flawed, a statistical equity risk model applied to portfolio holdings is close to the ideal.
Equity Market Hedging Techniques
We analyze approximately 3,000 non-index U.S. Equity Mutual Funds over 10 years. These provide a broad sample of the real-world long equity portfolios that investors may attempt to hedge. We evaluate the effectiveness of three techniques for calculating hedge ratios:
- Assuming constant 100% market exposure (1 beta): Absent deeper statistical analysis, it is common to assume that all portfolios have the same market risk, equal to that of the broad benchmarks.
- Using returns-based style analysis (RBSA): RBSA is a popular technique that attempts to estimate portfolio factor exposures by regressing portfolio returns against factor returns.
- Applying a statistical equity risk model to portfolio holdings: This technique essentially performs RBSA on the individual portfolio holdings and aggregates the results.
For each fund and for each month of history we calculate market exposure at the end of the month and then use this estimated (ex-ante) exposure to hedge the fund during the following month. We then analyze realized (ex-post) 12-month hedged portfolio returns and calculate their correlations to the Market. The lower this correlation, the more effective a hedging technique is at eliminating systematic market exposure of a typical U.S. equity mutual fund portfolio.
Realized Market Correlations of Hedged U.S. Mutual Fund Portfolios
Realized Market Correlations of Random Return Series
An effective hedging technique should produce zero mean and median market correlations of hedged portfolio returns. Yet, if sufficiently large, even a set of perfectly random 12-month return series will contain some with large market correlations. Since our study covers over 200,000 12-month samples (observations), some market correlations are close to 1 by mere chance. To account for this and to create a baseline for comparisons, we calculated market correlations for random return series with a Monte Carlo simulation. These results, attainable only with a perfect hedge, are the baseline against which we evaluate equity market hedging techniques:
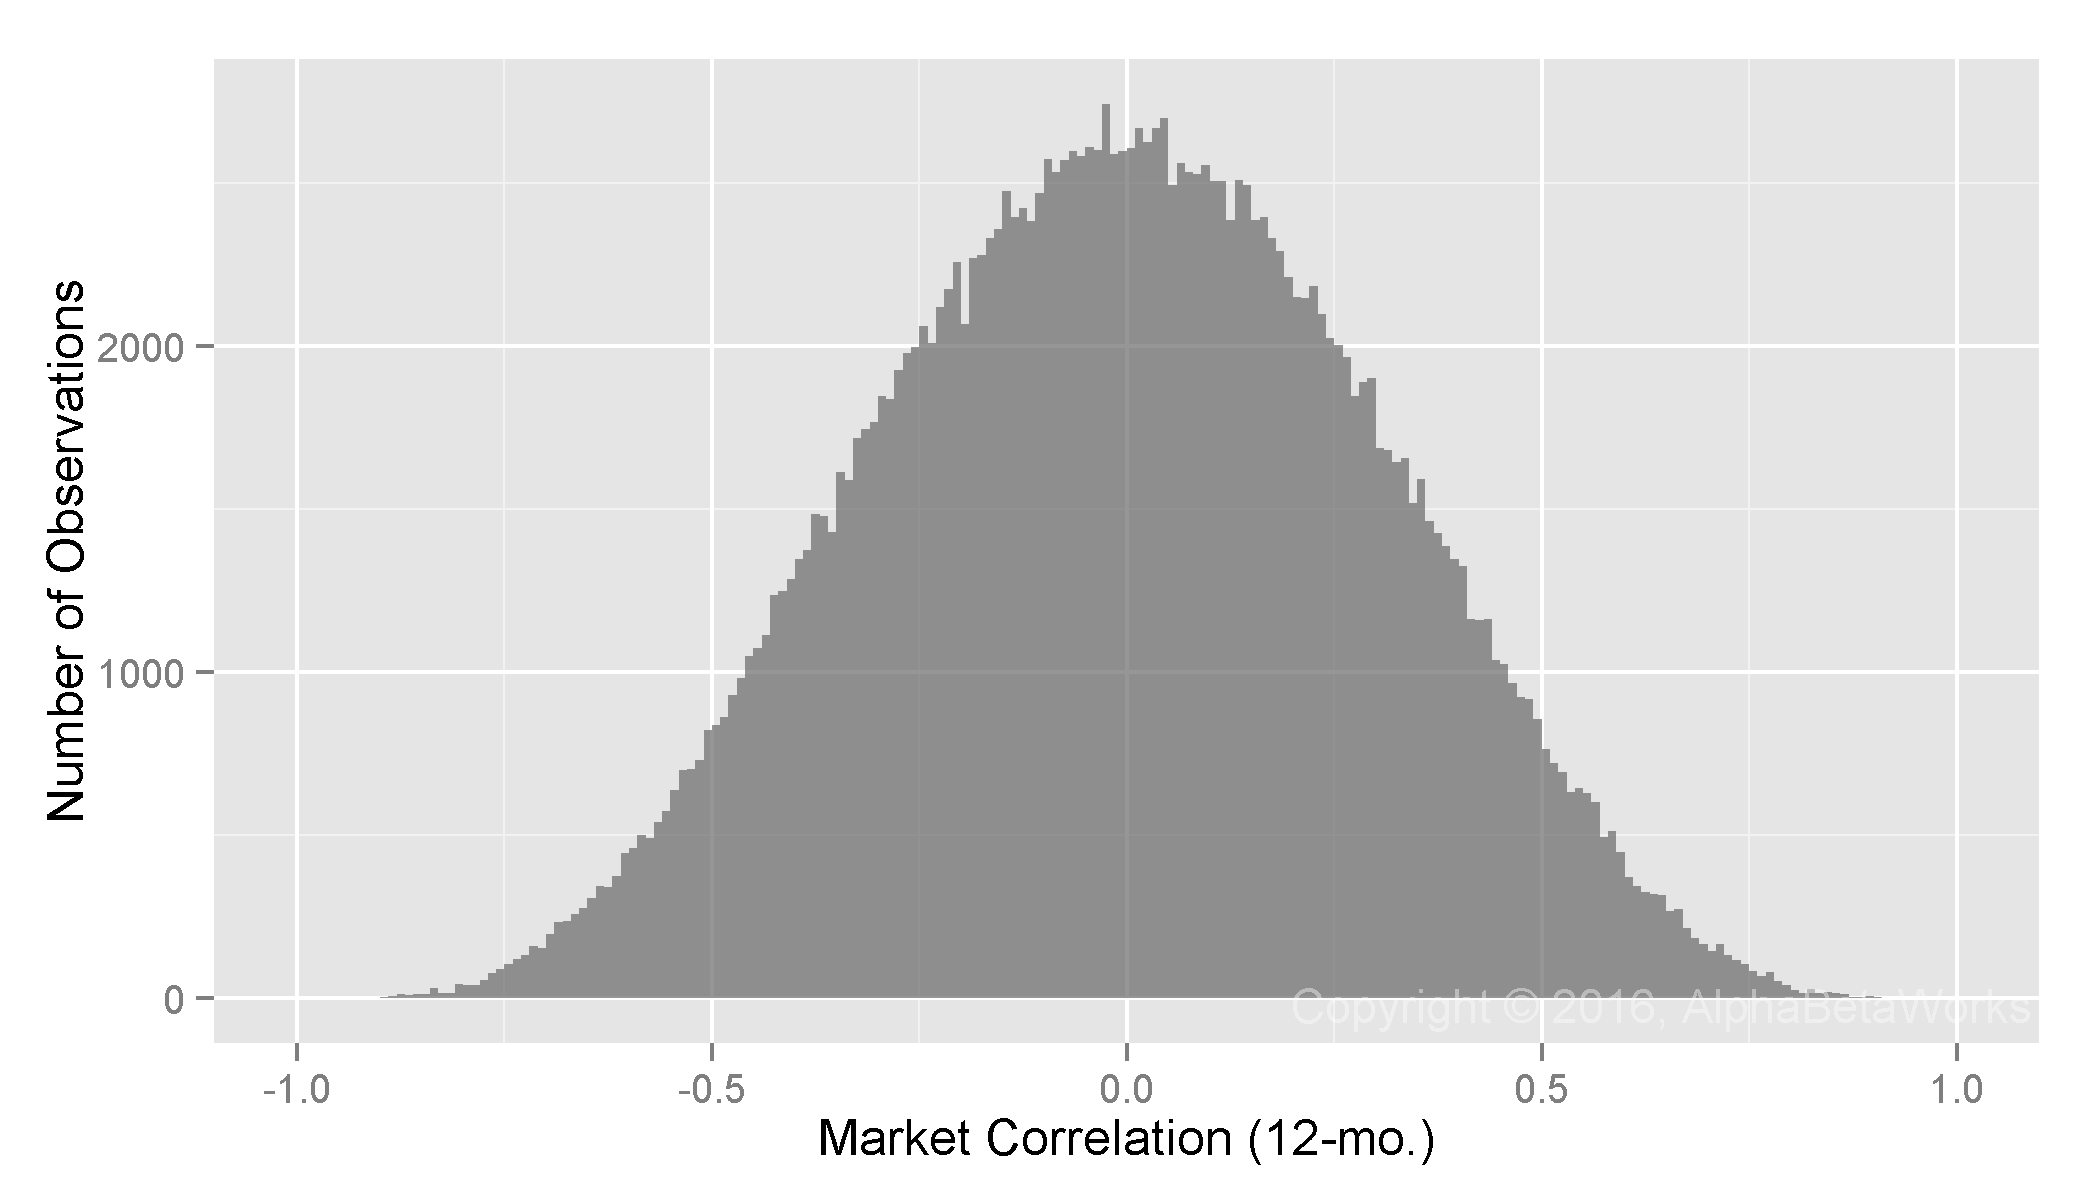
Realized 12-month market correlations of random return series
    Min.    1st Qu.     Median       Mean    3rd Qu.       Max.
  -0.9243    -0.2162     0.0001    -0.0006     0.2146     0.9409
Realized Market Correlations of Portfolios Hedged using a 100% Market Short
A naive assumption that market exposures of all portfolios are 100% (market betas of all portfolios are 1) is obviously wrong:
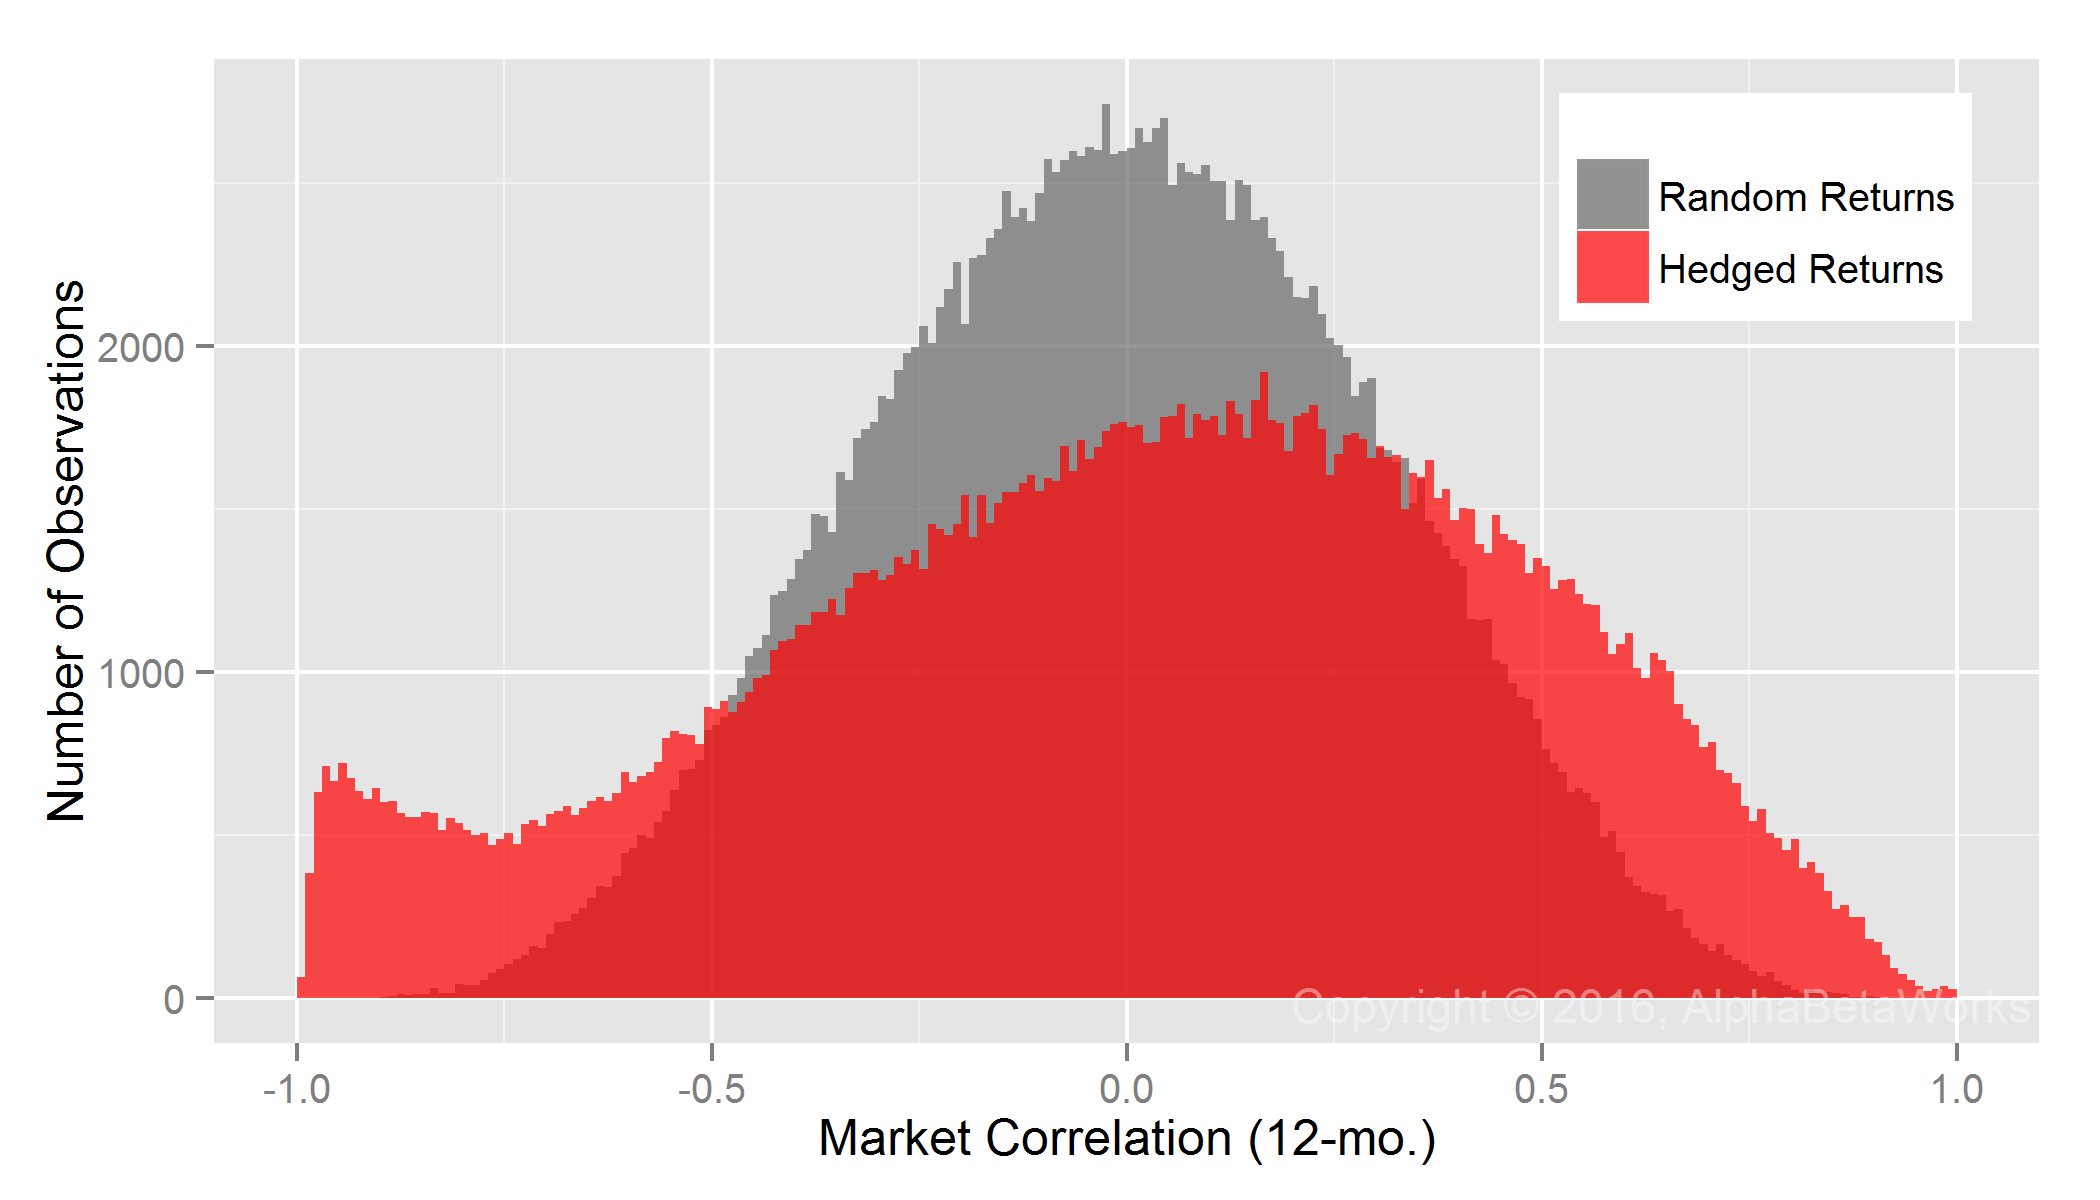
U.S. Equity Mutual Funds: Realized 12-month market correlations of portfolios hedged using a 100% market short
    Min.  1st Qu.   Median     Mean  3rd Qu.     Max.
  -0.9956  -0.2927   0.0469   0.0148   0.3527   0.9958
This approach over-hedges some portfolios and under-hedges others. There is a group of low-exposure portfolios for which a fixed 100% market short is too large. These produce a fat tail of negative market correlations of nearly -1 for some hedged portfolios. There is also a group of portfolios for which a fixed 100% market hedge is too small.
Realized Market Correlations of Portfolios Hedged using Returns-Based Analysis
Returns-based style analysis with multiple factors suffers from known issues of overfitting and collinearity. Less well-known are the problems that arise from RBSA’s assumption that exposures are constant over the regression window. In practice, portfolio exposures vary over time and can change rapidly as positions change. RBSA will capture these changes months or even years later once they influence portfolio returns, if at all.
RBSA thus fails similarly to the fixed hedging above, if less dramatically: hedges are too large in some cases and too small in others. The exposure estimates are also apparently biased, since they produce hedges that are too large and market correlations that are negative, on average:

U.S. Equity Mutual Funds: Realized 12-month market correlations of portfolios hedged using returns-based style analysis
    Min.  1st Qu.   Median     Mean  3rd Qu.     Max.
  -0.9946  -0.3229  -0.0518  -0.0459   0.2274   0.9762
Realized Market Correlations of Portfolios Hedged using a Statistical Equity Risk Model
The AlphaBetaWorks Statistical Equity Risk Model produces hedges close to the ideal:
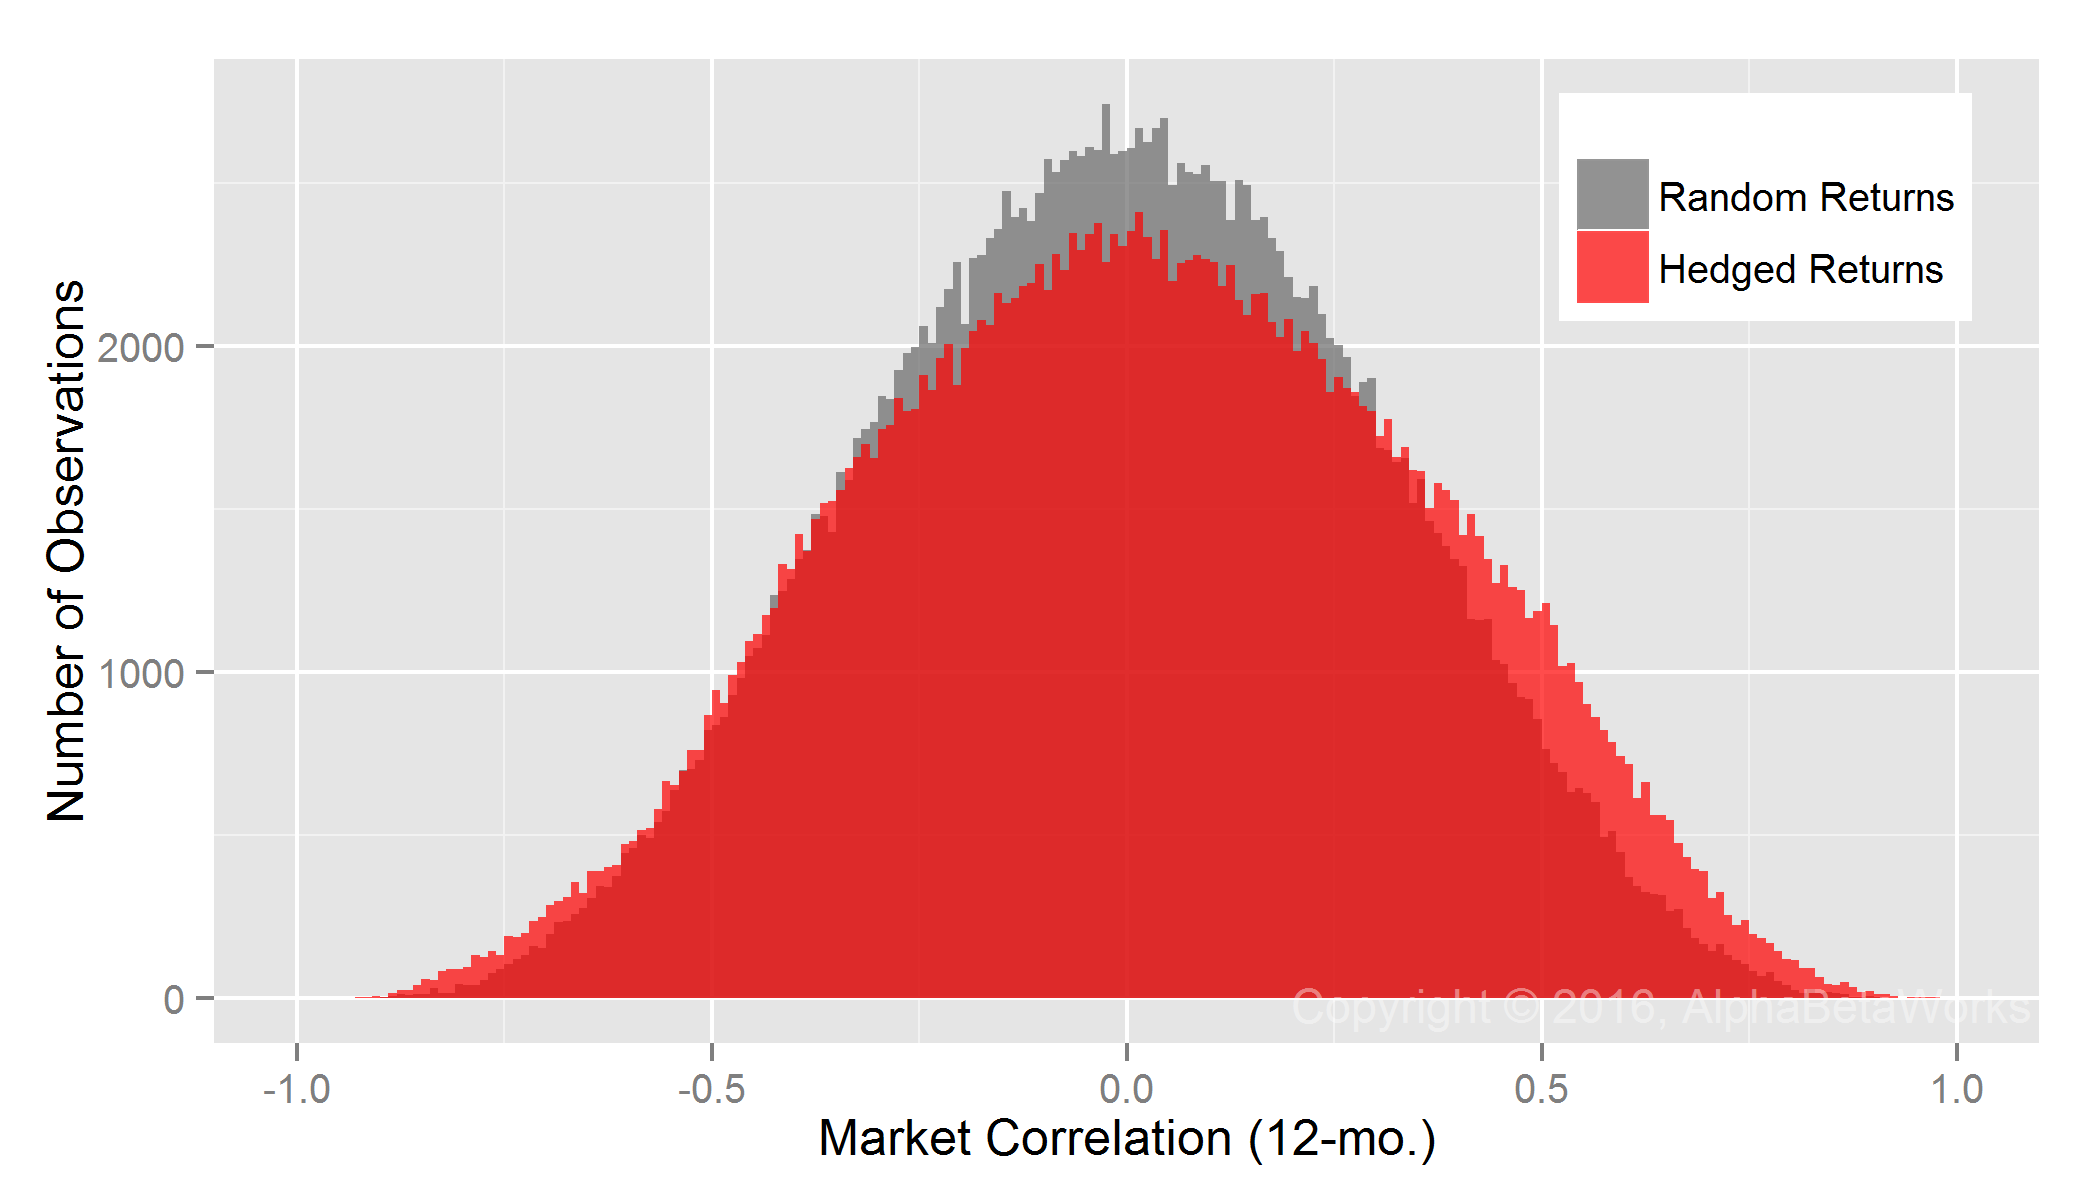
U.S. Equity Mutual Funds: Realized 12-month market correlations of portfolios hedged using a statistical equity risk model applied to holdings
    Min.  1st Qu.   Median     Mean  3rd Qu.     Max.
  -0.9565  -0.2230   0.0184   0.0214   0.2669   0.9755
The model estimates security market exposures using robust regression methods to control for outliers. Though robust techniques perform well for most portfolios, they appear to produce hedge ratios that are too low for some high-beta portfolios. This leads to small positive mean and median market correlations of hedged portfolio returns and to the higher probability of positive market correlations compared to random portfolios.
Aside from this under-hedging of a small fraction of portfolios, application of the AlphBetaWorks Statistical Equity risk model to fund holdings comes closest to perfect equity market hedging. Portfolio managers and investors who rely on robust risk models and hedging techniques can thus nearly perfectly hedge the market risk of a typical equity portfolio.
Summary
- The effectiveness of equity market hedging techniques can be assessed by comparing hedged portfolio returns to random portfolio returns that would be produced by a perfect hedge.
- Simplistic hedging that assumes 1 beta for all portfolios fails, most spectacularly for low-risk portfolios.
- Returns-based style analysis (RBSA) both over-hedges and under-hedges, likely due to its failure to capture rapidly changing exposures.
- Analysis of fund holdings using a Statistical Equity Risk Model comes closest to perfect equity market hedging.


