In Early – Out Just in Time
Our recent article established that a portfolio of skilled stock pickers’ ideas generates consistent alpha. This brief analyzes what the AlphaBetaWorks Expert Aggregate had to say about one controversial name, Valeant Pharmaceuticals (VRX). In short, the smart money was in early and left almost a year before Valeant’s recent headaches.
Performance of the Top U.S. Stock Pickers
Since genuine investment skill persists, top U.S. stock pickers tend to generate persistently positive returns from security selection (idiosyncratic, residual returns). This strong performance derives from the top stock pickers’ individual positions. Their consensus exposures thus cut through the fog of panic and confusion, such as that surrounding VRX.
We track institutional ownership of Valeant by the AlphaBetaWorks Expert Aggregate (ABW Expert Aggregate). The ABW Expert Aggregate is sourced from all institutions that have filed Form 13F.
Nominal returns and related simplistic metrics of investment skill (Sharpe Ratio, Win/Loss Ratio, etc.) are dominated by systematic factors and thus revert. So for an accurate assessment of manager skill, we must eliminate the systematic effects and estimate residual performance due to stock picking. The AlphaBetaWorks Performance Analytics Platform calculates each portfolio’s return from security selection – αReturn. αReturn is the performance a portfolio would have generated if all factor returns had been flat. Each month we identify the five percent of 13F-filers with the most consistently positive αReturns over the prior 36 months. This expert panel of the top stock pickers typically consists of 100-150 firms.
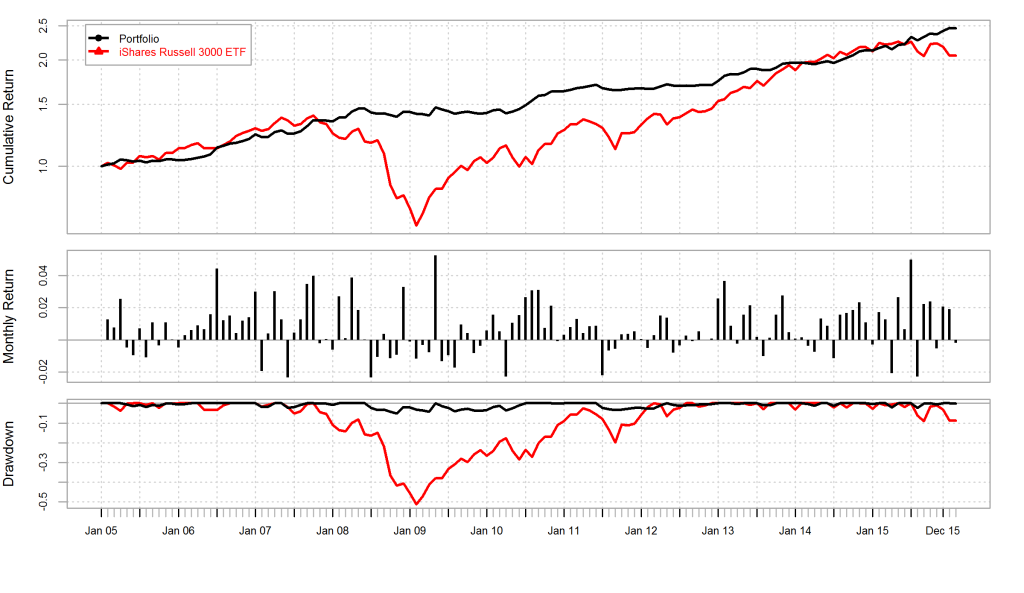
A hedged portfolio that combines the top U.S. stock pickers’ net consensus longs (relative overweights) – lagged 2 months to account for filing delay (the ABW Expert Aggregate) – delivers consistent positive returns as illustrated below:
| 2005 | 2006 | 2007 | 2008 | 2009 | 2010 | 2011 | 2012 | 2013 | 2014 | 2015 | 2016 | |
| ABW Expert Aggregate | 4.56 | 14.43 | 12.74 | 5.95 | -1.25 | 15.35 | 2.20 | 2.24 | 15.47 | 8.81 | 13.16 | 1.70 |
| iShares Russell 3000 ETF | 9.04 | 15.65 | 4.57 | -37.16 | 28.21 | 16.81 | 0.78 | 16.43 | 32.97 | 12.41 | 0.34 | -5.72 |
| ABW Expert Aggregate | iShares Russell 3000 ETF | |
| Annualized Return | 8.36 | 6.40 |
| Annualized Standard Deviation | 5.25 | 15.50 |
| Annualized Sharpe Ratio (Rf=0%) | 1.59 | 0.41 |
Top Stock Pickers’ Exposure to Valeant Pharmaceuticals (VRX)
The positive idiosyncratic returns of the ABW Expert Aggregate come from its individual positions: Its longs (experts’ relative overweights) tend to generate positive future αReturns. Its shorts (experts’ relative underweights) tend to generate negative future αReturns. The ABW Expert Aggregate thus measures the top stock pickers’ positioning which is predictive of the stocks’ future performance.
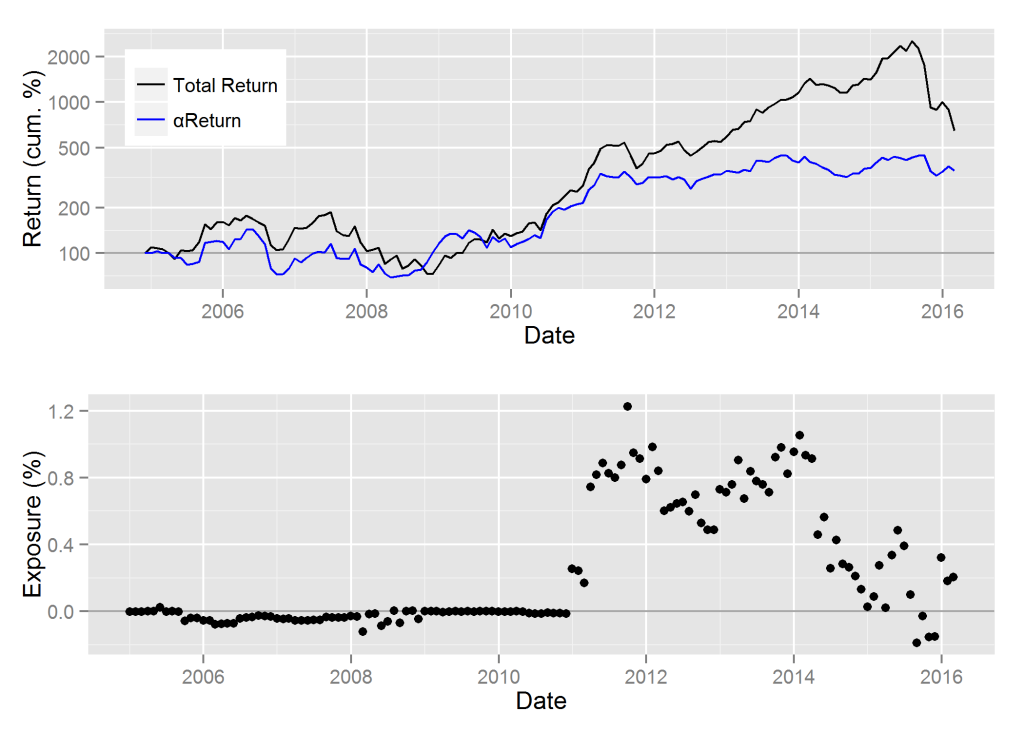
The top panel on the following chart shows the performance of VRX. Nominal returns are in black and cumulative residual returns (αReturns) are in blue. αReturn is the performance VRX would have generated if all systematic factor returns had been flat. The bottom panel shows exposure to VRX within the ABW Expert Aggregate:
Top stock pickers had negligible exposure to VRX until 2011. In early-2011 smart-money exposure to VRX grew rapidly, peaking between 2012 and 2014. Throughout 2014, as the shares appreciated, the top U.S. stock pickers sharply cut their exposure to VRX.
The panic hit a year after the top stock pickers dramatically cut their exposure. By 2015 smart-money exposure to VRX was a mixed signal as it tracked the stock’s volatility. Ironically, this is when VRX became one of the most crowded hedge fund bets. Though VRX had a history of smart-money ownership, this vote of confidence was withdrawn by 2015. Future stock-specific returns to VRX, as predicted by the ABW Expert Aggregate, increased rapidly in 2011 and dropped rapidly by 2015.
Investors, allocators, and fund-followers, armed with our analytics, would have taken note. Those looking for the smart money to back their long or short views of VRX must now look elsewhere.
Conclusions
- Top stock pickers’ ownership is predictive of future stock performance, since their net consensus longs (relative overweights) tend to generate positive future αReturns and net consensus shorts (relative underweights) tend to generate negative future αReturns.
- Valeant Pharmaceuticals (VRX) was a large overweight of the top stock pickers between 2011 and 2014, but these positions were mostly liquidated by 2015.
- Top stock pickers’ current ownership of VRX is not a predictive indicator, but their rapid liquidation in 2014 was a visible warning.


