
Equity risk models can be complex and hard to interpret. Moreover, differences in financial reporting and transparency across markets, sectors, and companies can lead to inaccurate predictions and counter-intuitive exposures for common fundamental models. These problems are especially severe for sector-focused portfolios. For instance, generic fundamental models may use a single broad Leverage Factor to explain the profoundly different impacts of financial leverage on the risk of Airlines, REITs, and Oil Producers, with mixed results at best. Yet, when properly constructed with robust methods, statistical equity risk models that capture the relevant and intuitive sector-specific risk factors are highly predictive. We illustrate this predictive accuracy with a study of 1,000 REIT portfolios.
Real Estate Investment Trust (REIT) Portfolio Sample
We used Vanguard REIT Index Fund (VNQ) to define the Real Estate Investment Trust (REIT) Market Universe. To test equity risk models on realistic REIT portfolios, we constructed 1,000 random portfolios from VNQ. Each portfolio contained 20 equal-weighted positions and spanned 10 years. These random subsets of the REIT Universe should be representative of a typical REIT portfolio based on VNQ’s holdings with a 5% average position size.
Testing Predictive Power of Equity Risk Models
We follow the approach of our earlier studies of risk model accuracy. To evaluate the predictive accuracy of an equity risk model, we compare returns predicted by past factor exposures to the subsequent portfolio performance: We calculate factor exposures using holdings at the end of each month and predict the following month’s returns using these ex-ante factor exposures and ex-post factor returns.
The correlation between predicted and actual returns measures a model’s accuracy. The higher the correlation, the more effective a model is at hedging, stress testing and scenario analysis, as well as evaluating investment skill.
Testing Statistical Equity Risk Model with High-level Sectors
The default AlphaBetaWorks U.S. Equity Statistical Risk Model uses 10 high-level Sector Factors in addition to Market, Style (Value/Growth and Size) and a few Macroeconomic Factors (Bonds, Oil, Currency, etc.). Though these high-level factors are sufficient to predict accurately the performance of most mutual fund portfolios and most long equity hedge fund portfolios, they do not adequately capture the sector-specific systematic risk of REITs with their broad Finance Factor. In short, our model’s “standard setting” does not provide a fine enough focus for these instruments. For half of the REIT portfolios tested, the model delivers less than 0.80 correlation between predicted and actual monthly returns:
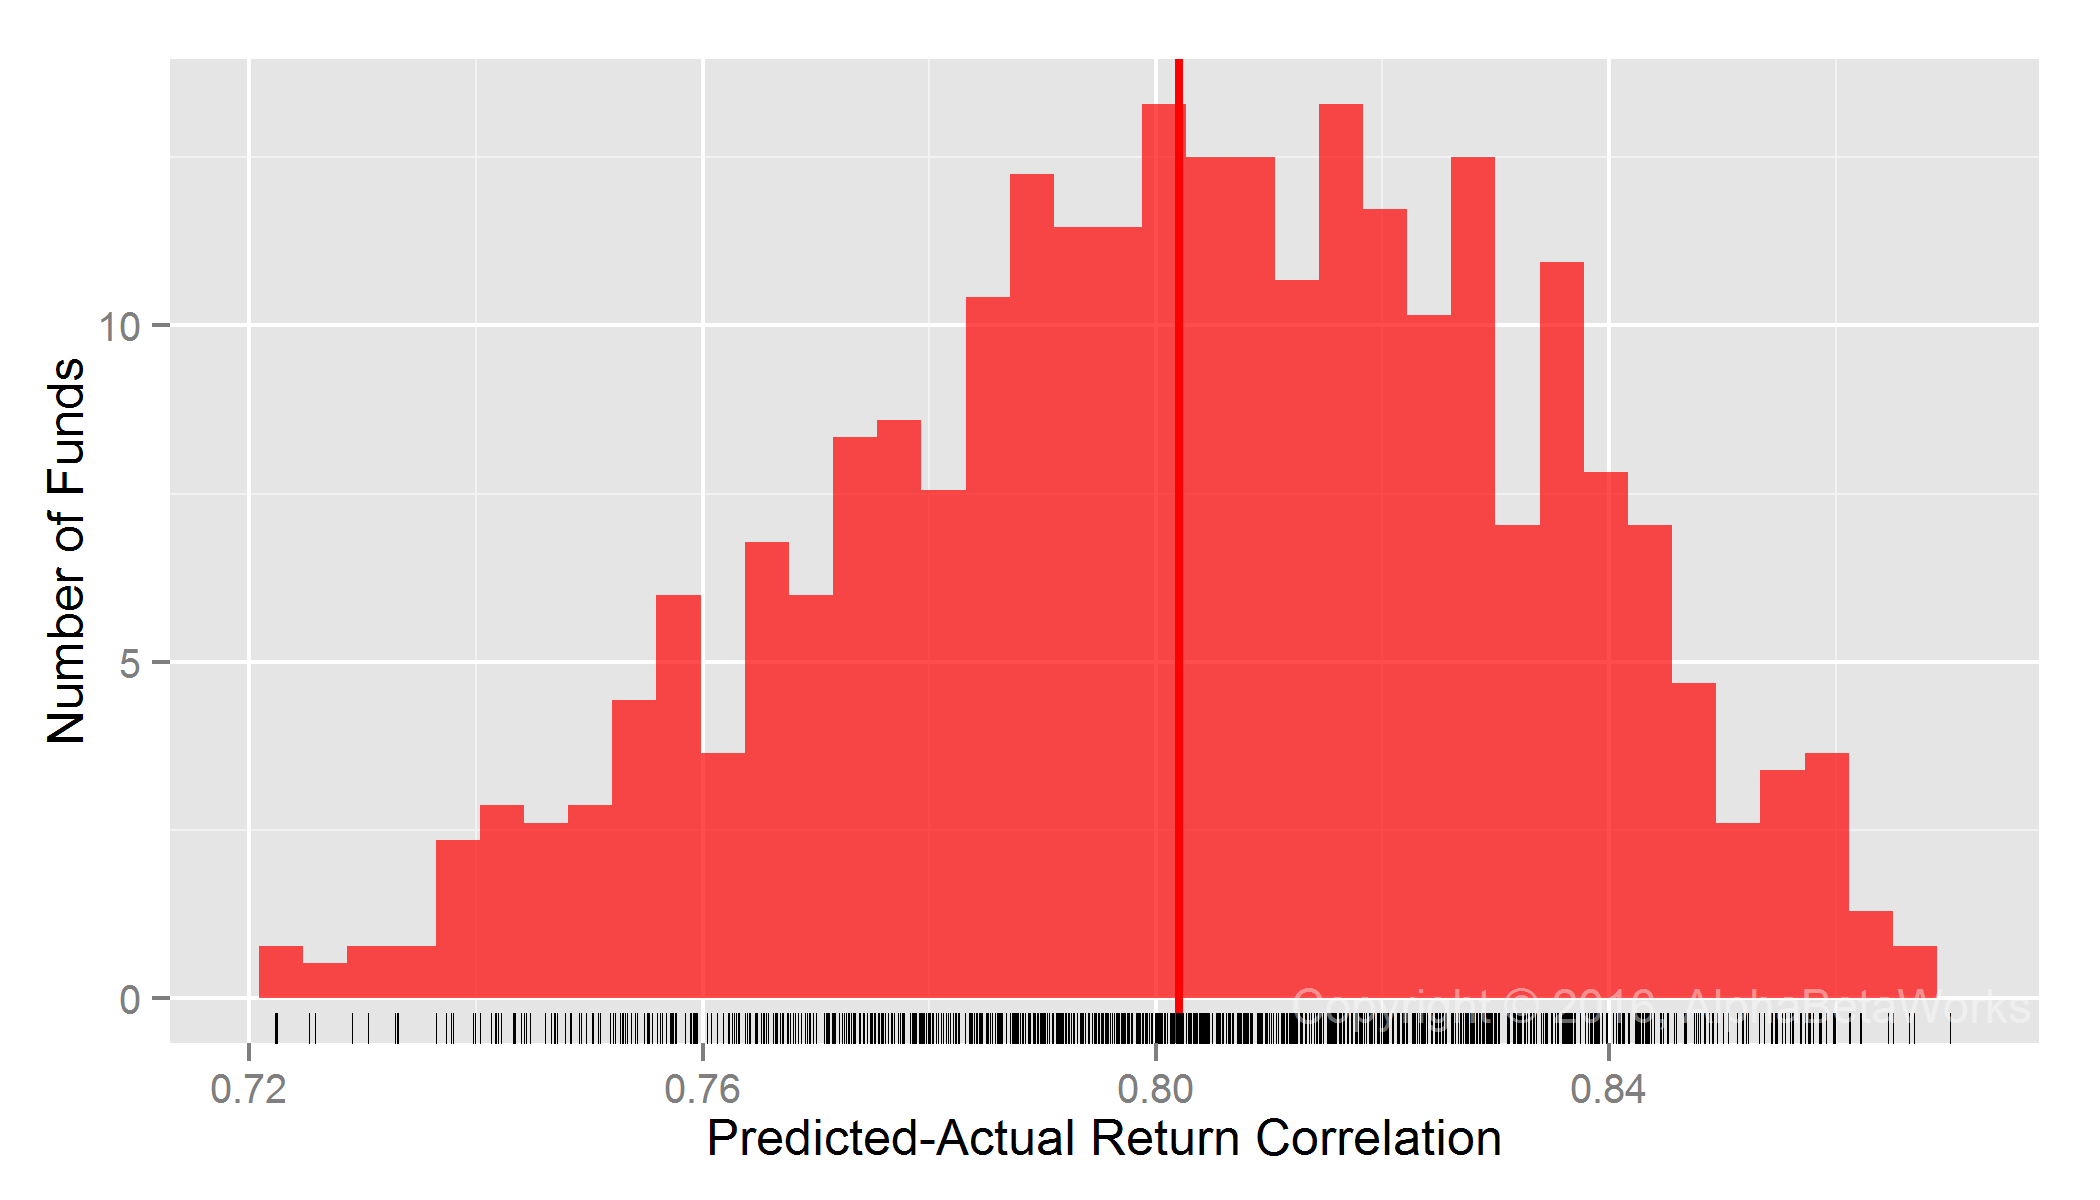
U.S. REIT Portfolios: Correlation between predictions and actual monthly returns for a statistical equity risk model with high-level sectors
  Min. 1st Qu.  Median    Mean 3rd Qu.    Max.
0.7052  0.7821  0.8038  0.8021  0.8250  0.8823
Testing Statistical Equity Risk Model with Granular Sectors
For REITs, a more focused model is necessary. Fortunately, we offer such refined models for more accurate results. The 10 high-level sectors of the default AlphaBetaWorks U.S. Equity Statistical Risk Model can be sub-divided into more granular sectors to handle portfolios that are restricted to a narrow market subset. The AlphaBetaWorks Granular Sector Model that includes the REIT Sector Factor is far more effective in this case. For most REIT portfolios tested, the model delivered 0.94 or higher correlation between predicted and actual monthly returns:
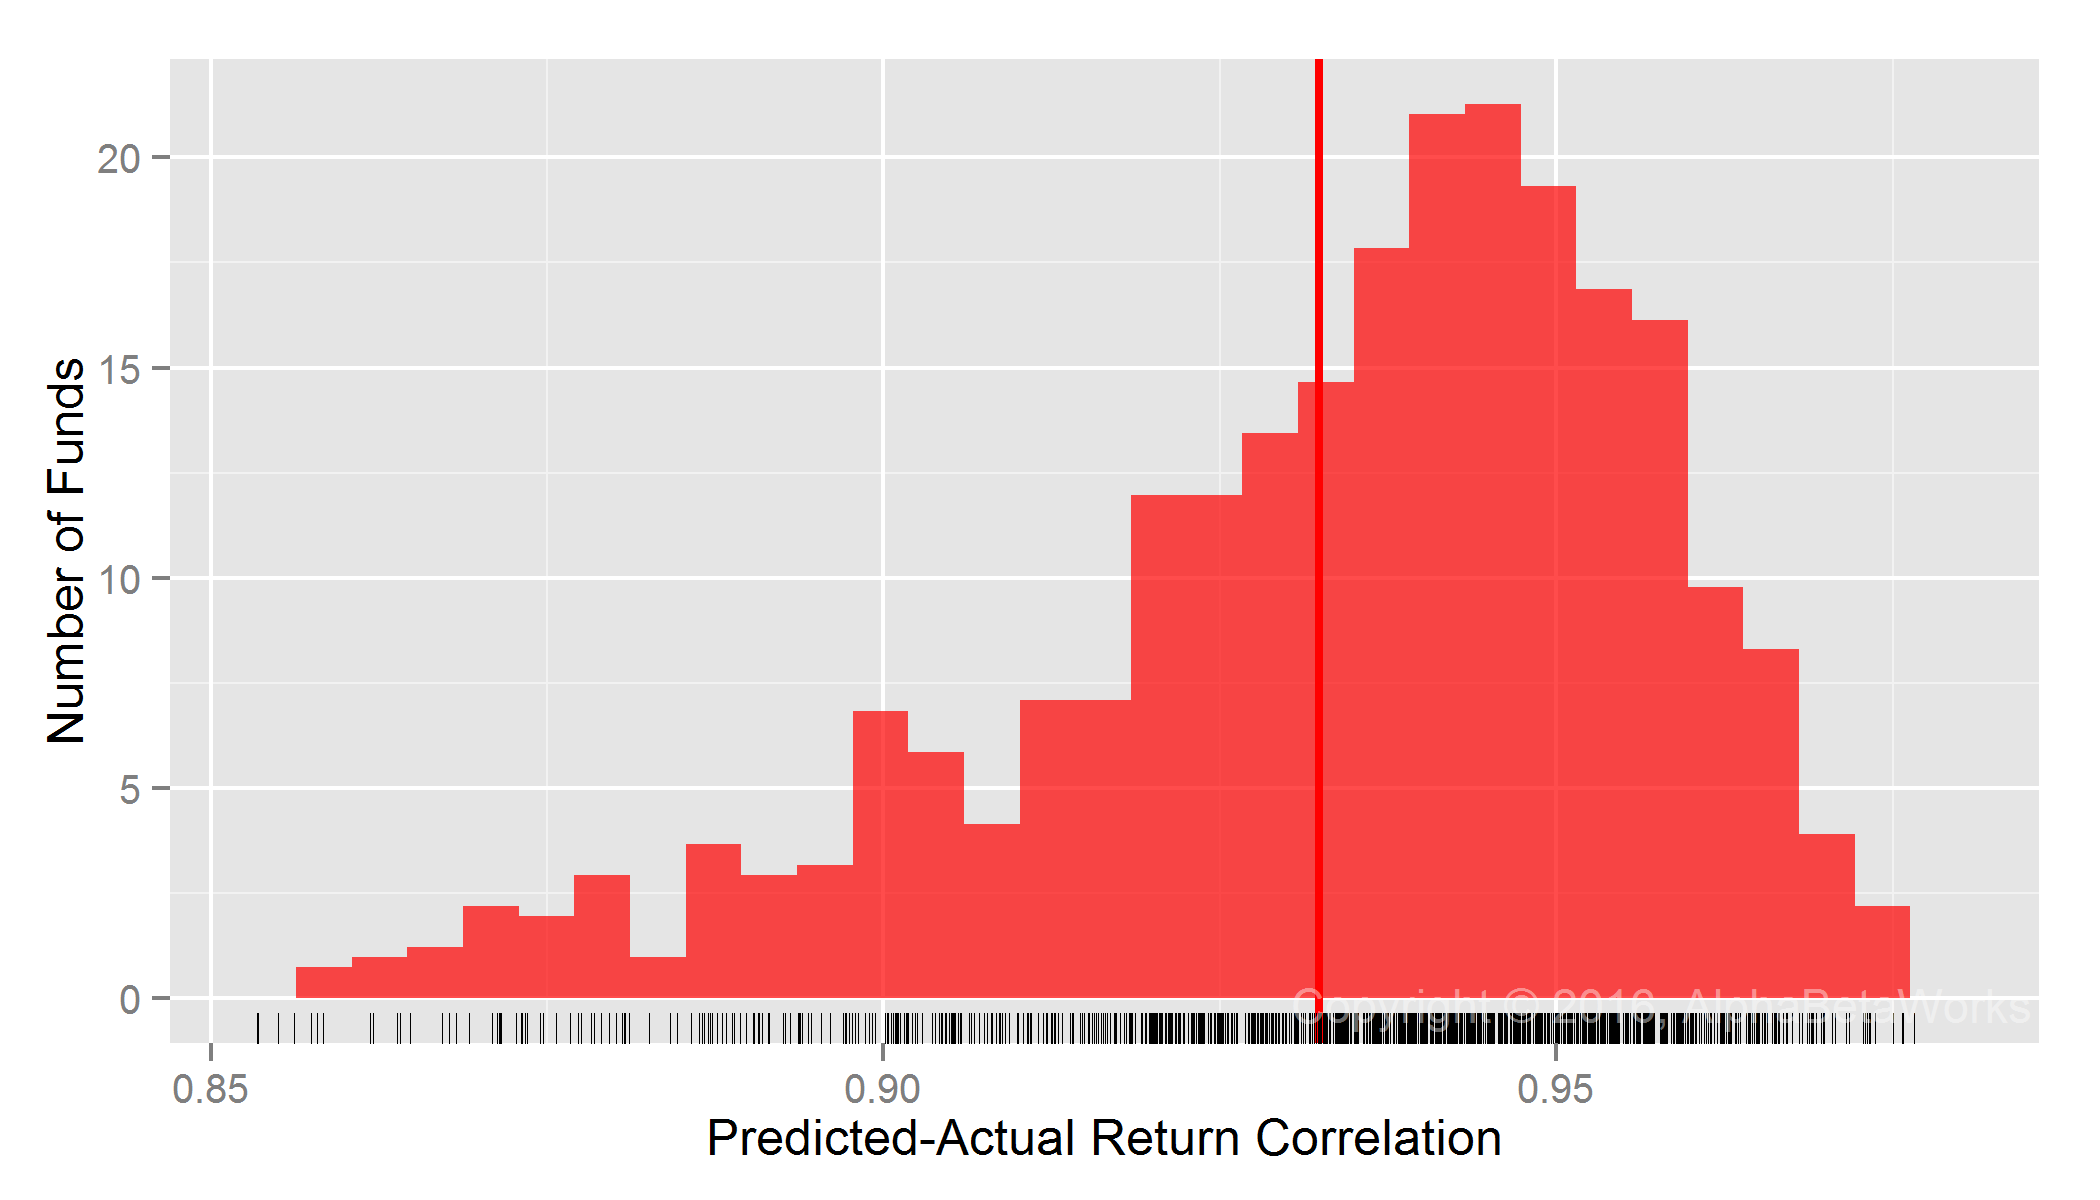
U.S. REIT Portfolios: Correlation between predictions and actual monthly returns for a statistical equity risk model with granular sectors
  Min. 1st Qu.  Median    Mean 3rd Qu.    Max.
0.7886  0.9202  0.9385  0.9324  0.9507  0.9766
Even for the 25% REIT portfolios it handled the worst, the model still achieved 0.79-0.92 correlation between predicted and actual returns.
Summary
- Fundamental equity models often fail for sector-focused portfolios, such as REITs.
- Statistical equity risk models with a few intuitive factors deliver accurate predictions for sector-focused portfolios, provided they are sufficiently robust and granular.
- For most REIT portfolios tested, a robust statistical equity risk model with a REIT Sector Factor delivered over 0.94 correlation between predicted and actual monthly returns.
- Greater model complexity offers diminishing returns: Even a perfect equity risk model would, at most, yield 0.06 higher correlation and explain 12% more ex-post monthly return variance.


How are the out-of-sample results?
Thanks for bringing up the key point — these results are out of sample: Factor exposure estimates are ex-ante; monthly correlations are ex-pos.
Further detail: To compare 1/2016 predicted and actual returns the test uses factor exposures estimated on 12/31/2015. Factor exposures for 12/31/2015 are estimated from positions on 12/31/2015 and the prior five years (120 months during 12/31/2000-12/31/2015) of security returns. So time travel/rear-view-mirror flaws that plague typical returns-based-analysis do not apply.