Tag Archives: crowding

Hedge Fund Industrials Factor Timing

In an earlier post, we discussed the largest bets hedge fund long portfolios were making in Q1 2015. The third largest was on the Industrials Factor. This is the risk specific to the industrials sector after controlling for market exposure. It captures capital allocation to industrials and sensitivity (beta) to the sector. There is weak statistical evidence of poor industrials factor timing by hedge funds – investors who follow hedge funds should either ignore this bet or treat it as a negative indicator.

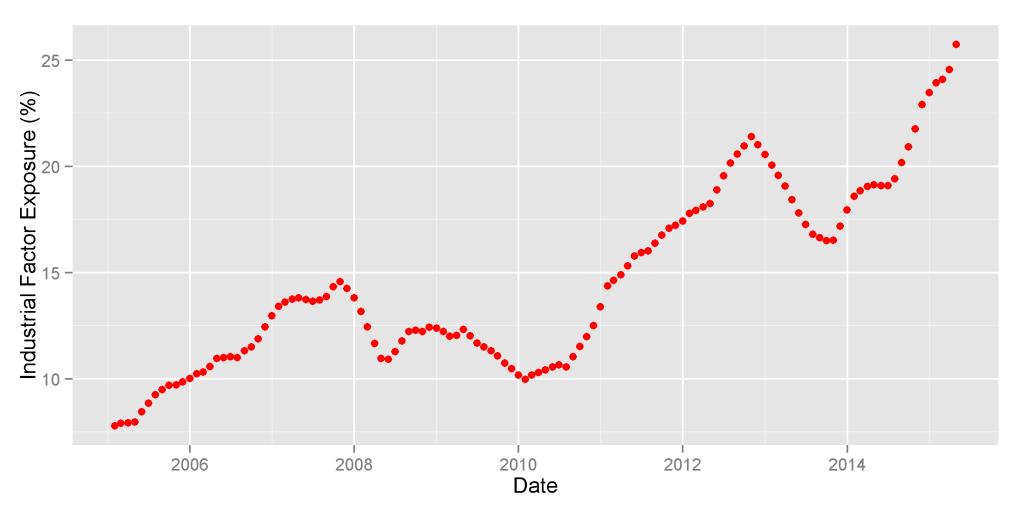
At the end of Q1 2015, high industrials sector factor exposure was the third largest source of U.S. hedge funds’ long portfolio crowding. HF Aggregate, a portfolio consisting of popular long U.S. equity holdings of all hedge funds tractable from quarterly filings, had over 25% industrials factor exposure – a 9% overweight relative to Market. This exposure was at an all-time high:

Chart of the historical industrials factor exposure of U.S. Hedge Fund Aggregate

U.S. Hedge Fund Aggregate’s Industrials Sector Factor Exposure History

This industrials factor exposure captures sector risk after controlling for market exposure. For example, a fund with 10% allocated to a broad industrials index will have approximately 10% industrials factor exposure. A fund with 10% allocated to a 2x-levered broad industrials ETF will have approximately 20% industrials factor exposure.

Here we analyze the hedge fund industry’s skill in timing the U.S. Industrials Factor by varying this exposure. The AlphaBetaWorks Performance Analytics Platform evaluates market timing skills and performance using two related tests:

  • Statistical test for the relationship between factor exposure and subsequent factor returns,
  • Statistical test for the size and consistency of returns generated by varying factor exposures.

Hedge Fund Industrials Factor Exposure and Industrials Factor Return

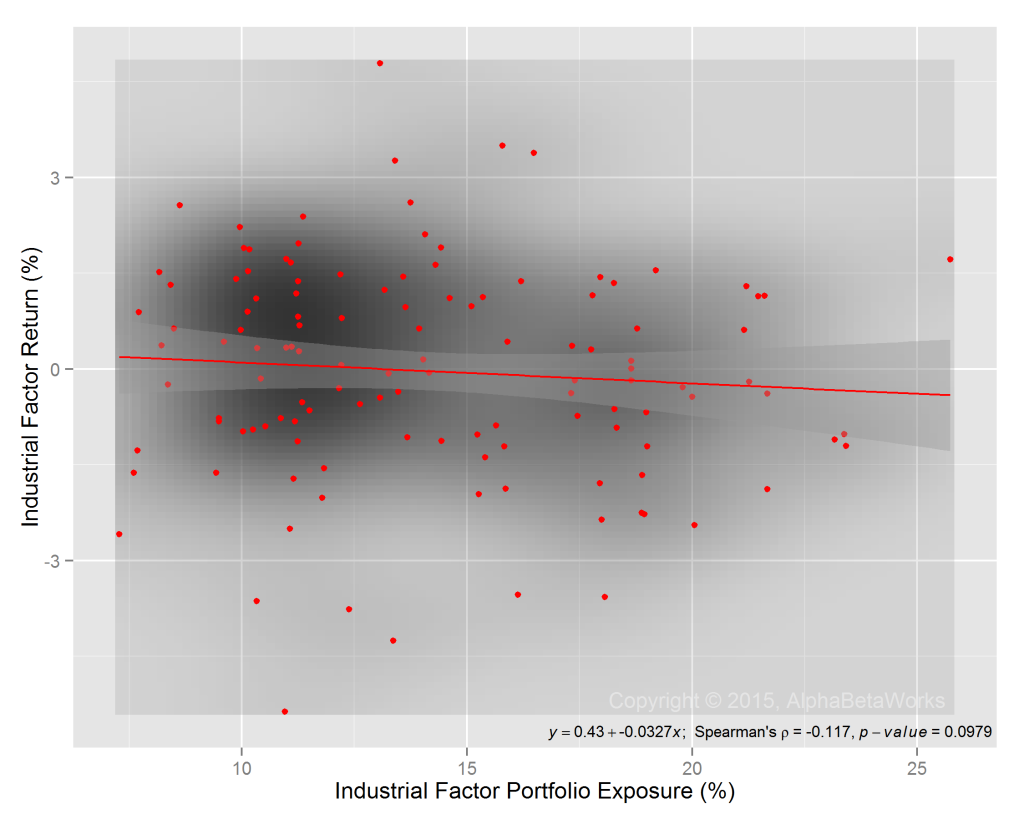
We calculated the Spearman’s rank correlation coefficient of HF Aggregate’s industrials factor exposure and subsequent industrials factor return for the past 10 years and tested it for significance. The chart below illustrates the correlation between the two series and the test results:

Chart of the correlation between historical industrials factor exposure of U.S. Hedge Fund Aggregate and subsequent factor return

U.S. Hedge Fund Aggregate’s Industrials Factor Exposure and Return

There is a statistically weak negative relationship between HF Aggregate’s industrials factor exposure and subsequent factor performance. Hedge fund industrials factor exposure is a weak predictor of future industrials returns.

Hedge Fund Industrials Factor Timing Returns

Over the past 10 years, HF Aggregate (USHFS in red) made approximately 0.9% less than it would have with constant industrials factor exposure, as illustrated below. The performance of HF Aggregate is compared to all tractable 13F filers (Group in gray). The AlphaBetaWorks Performance Analytics Platform identifies this performance due to industrials factor timing as industrials βReturn:

Chart of the cumulative historical contribution of variation in industrials factor exposure of U.S. Hedge Fund Aggregate to the Aggregate’s performance

U.S. Hedge Fund Aggregate’s Industrials Factor Timing Return

The weak evidence of poor industrials factor timing by the industry, combined with the high recent industrials factor exposure, is a weak bearish indicator for the sector.

Summary

  • The industrials factor exposure of U.S. hedge funds’ long portfolios is weakly predictive of subsequent sector performance.
  • Current hedge fund industrials factor exposure, at 10-year highs, is a weak bearish indicator for the Industrials Sector.
  • Investors who track hedge fund holdings should either ignore this bet or treat is as a negative indicator.
The information herein is not represented or warranted to be accurate, correct, complete or timely.
Past performance is no guarantee of future results.
Copyright © 2012-2015, AlphaBetaWorks, a division of Alpha Beta Analytics, LLC. All rights reserved.
Content may not be republished without express written consent.

Hedge Fund Oil Factor Timing

In an earlier post, we discussed the largest bets hedge fund long portfolios were making in Q1 2015. The second largest was on the oil price. This exposure is the residual oil price risk after controlling for market and sector exposures. It captures overweighting within various sectors of companies that out- or underperform under rising oil price. There is weak statistical evidence of skilled oil factor timing by hedge funds – the current bet is a weak bullish indicator for oil prices.

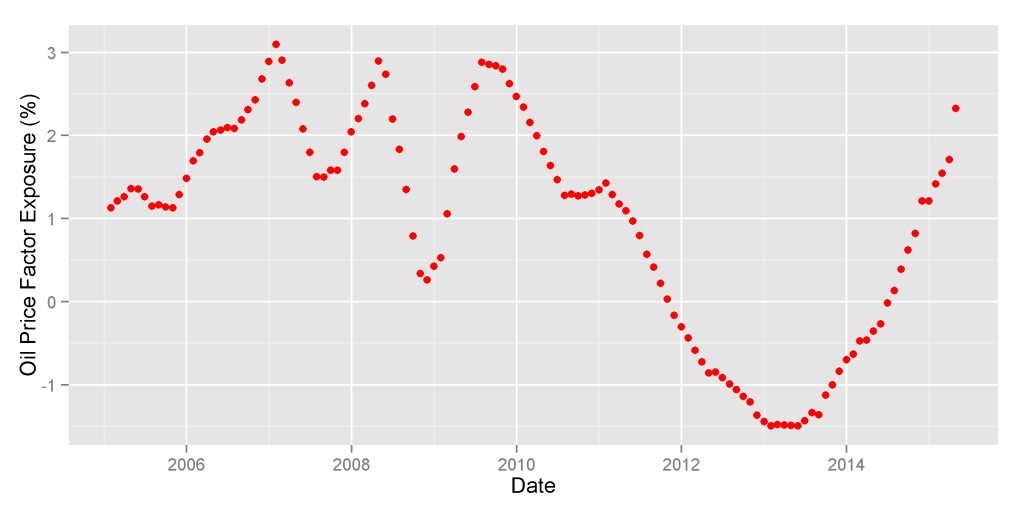
At the end of Q1 2015, high oil price factor exposure was the second largest source of U.S. hedge funds’ long portfolio crowding. HF Aggregate, a portfolio consisting of popular long U.S. equity holdings of all hedge funds tractable from quarterly filings, had approximately 2.5% oil price factor exposure. This exposure was approaching the 10-year highs reached in 2007-2009:

Chart of the exposure of oil price factor of the U.S. Hedge Fund Aggregate

U.S. Hedge Fund Aggregate’s Oil Factor Exposure History

This oil price exposure captures residual oil risk after controlling for sector exposures. For examples, airlines with higher operational or financial leverage than peers have negative oil price factor exposure – they will underperform peers when oil price increases; airlines with lower operational or financial leverage than peers have positive oil price factor exposure –they will outperform peers when oil price increases.

Here we analyze the hedge fund industry’s skill in timing the oil price by varying this intra-sector oil price risk. The AlphaBetaWorks Performance Analytics Platform evaluates market timing skills and performance using two related tests:

  • Statistical test for the relationship between factor exposure and subsequent factor returns,
  • Statistical test for the size and consistency of returns generated by varying factor exposures.

Hedge Fund Oil Factor Exposure and Oil Return

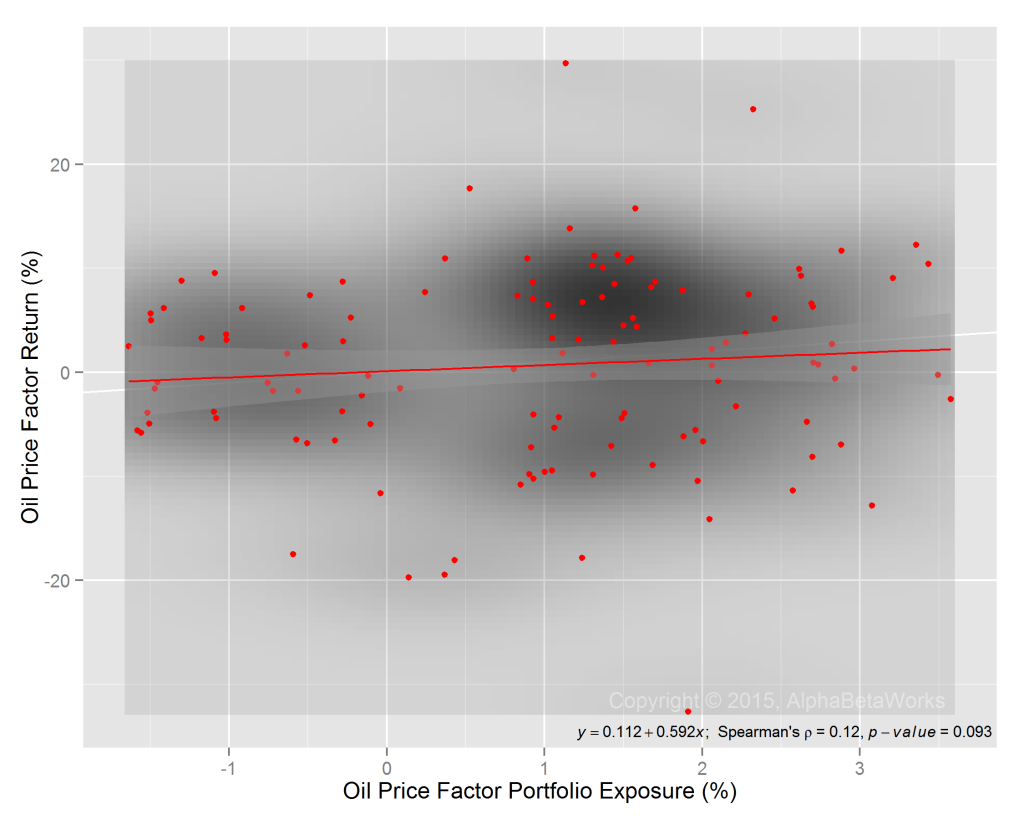
We calculated the Spearman’s rank correlation coefficient of HF Aggregate’s oil price factor exposure and subsequent oil price return and tested it for significance. The chart below illustrates the correlation between the two series and the test results:

Chart of the correlation between oil price factor exposure of the U.S. Hedge Fund Aggregate and subsequent oil price return

U.S. Hedge Fund Aggregate’s Oil Factor Exposure and Return

There is a statistically weak positive relationship between HF Aggregate’s oil factor exposure and subsequent oil performance. Hedge fund oil factor exposure is a weak indicator of future oil price direction.

Hedge Fund Oil Factor Timing Returns

Over the past 10 years, HF Aggregate (USHFS in red) made approximately 1.5% more than it would have with constant oil factor exposure, as illustrated below. The performance of HF Aggregate is compared to all tractable 13F filers (Group in gray). The AlphaBetaWorks Performance Analytics Platform identifies this performance due to oil price factor timing as oil price βReturn:

Chart of the return due to variation in oil price factor exposure of the U.S. Hedge Fund Aggregate

U.S. Hedge Fund Aggregate’s Oil Factor Timing Return

The weak evidence of oil factor timing skill by the industry, combined with the high recent oil factor exposure, is a weak bullish indicator for oil prices.

Summary

  • The oil price factor exposure of U.S. hedge funds’ long portfolios is weakly predictive of subsequent oil performance.
  • Current hedge fund oil factor exposure, near 10-year highs, is a weak bullish indicator for oil prices.
The information herein is not represented or warranted to be accurate, correct, complete or timely.
Past performance is no guarantee of future results.
Copyright © 2012-2015, AlphaBetaWorks, a division of Alpha Beta Analytics, LLC. All rights reserved.
Content may not be republished without express written consent.

Hedge Fund U.S. Market Timing

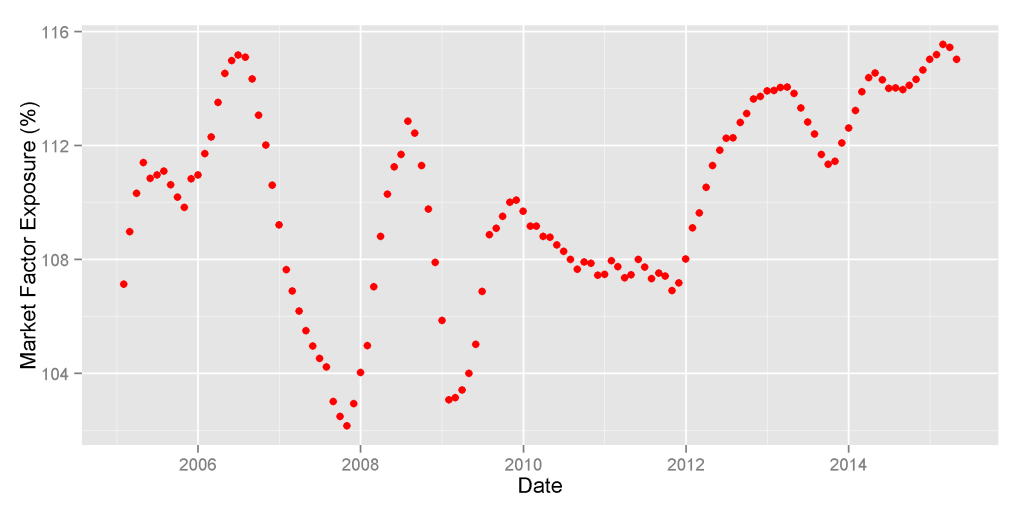
The single largest bet hedge fund long portfolios were making in Q1 2015 was on the U.S. market (high beta). While the bet is exceptionally large, it is not predictive of market direction. Allocators should pay attention to this risk aggregation.

At the end of Q1 2015, high market factor exposure (high beta) was the primary source of U.S. hedge funds’ long portfolio crowding. HF Aggregate, a portfolio consisting of popular long U.S. equity holdings of all hedge funds tractable from quarterly filings, had approximately 115% U.S. market factor exposure (1.15 U.S. market beta). This exposure was at 10-year highs – the level last seen in mid-2006:

Chart of the historical U.S. Market Factor exposure of U.S. Hedge Fund Aggregate

U.S. Hedge Fund Aggregate’s U.S. Market Factor Exposure History

Our work on hedge fund crowding has so far not addressed hedge fund factor timing and hedge fund U.S. market timing specifically. We dive into this performance here.

The AlphaBetaWorks Performance Analytics Platform evaluates market timing skills and performance using two related tests:

  • Statistical test for the relationship between factor exposure and subsequent factor returns,
  • Statistical test for the size and consistency of returns generated by varying factor exposures.

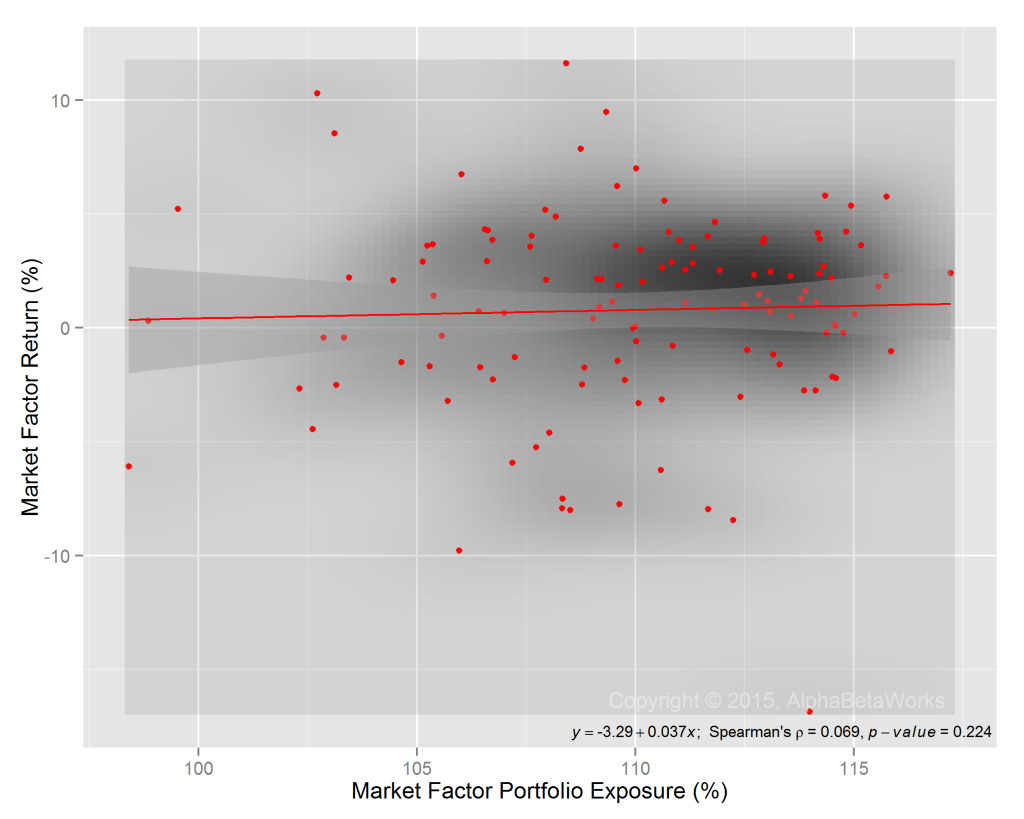
Hedge Fund Market Exposure and Market Return

We calculated the Spearman’s rank correlation coefficient of HF Aggregate’s market exposure and subsequent market return and tested it for significance. The chart below illustrates the correlation between the two series and the test results:

Chart of the correlation between the U.S. market exposure of long U.S. hedge fund equity portfolios and U.S. market return

U.S. Hedge Fund Aggregate’s U.S. Market Exposure and Return

The chart shows that there is a positive relationship between HF Aggregate’s U.S. market exposure and subsequent U.S. market return, but it is weak and statistically insignificant. In other words, hedge funds’ variation in U.S. market exposure has done little to help their performance.

Hedge Fund U.S. Market Timing Returns

Over the past 10 years, HF Aggregate (USHFS in red) made approximately 1% more than it would have with constant factor exposures, as illustrated below. The performance of HF Aggregate is compared to all tractable 13F filers (Group in gray). The AlphaBetaWorks Performance Analytics Platform identifies this performance due to U.S. market factor timing as U.S. market βReturn:

Chart of the historical return due to variation in U.S. market exposure of long U.S. hedge fund equity portfolios

U.S. Hedge Fund Aggregate’s U.S. Market Timing Return

The performance impact of this variation in beta within U.S. hedge fund long portfolios is also minor. However, the group of all 13F filers was a poor market timer, particularly during the volatility of 2008-2009. During the crisis, non-filers were the smart money and took advantage of U.S. market volatility, at the expense of 13F filers. 13F filers were a contrarian indicator.

Summary

  • Hedge fund long equity portfolios consistently take 5-15% more market risk than S&P500 and other broad market benchmarks.
  • There has been no statistically significant relationship between U.S. market exposure (market beta) of U.S. hedge funds’ long portfolios and subsequent market return.
  • The high market factor exposure of U.S. hedge funds’ long portfolios is not predictive of subsequent market returns.
  • The broader group of all 13F filers generated significant negative returns by varying market exposure, particularly during the 2008-2009 volatility.
The information herein is not represented or warranted to be accurate, correct, complete or timely.
Past performance is no guarantee of future results.
Copyright © 2012-2015, AlphaBetaWorks, a division of Alpha Beta Analytics, LLC. All rights reserved.
Content may not be republished without express written consent.


Hedge Fund Crowding Costs – eHealth

EHTH (eHealth, Inc.), an Internet health insurance agency, was down over 50% following disappointing revenue and EPS guidance. The events were yet another example of the mass sell-offs in crowded hedge fund bets after disappointing news. This once again demonstrates that investors must monitor their portfolios for crowding.

EHTH was not the largest stock-specific hedge fund insurance sector bet, but it was one of the least liquid. The aggregate crowded position constituted about nine days’ trading volume. As funds struggled to exit, more shares traded in one day than in the prior week, knocking the price down 54%. We illustrate how investors aware of this crowding could have avoided the losses.

To explore crowding we analyze hedge fund Life and Health Insurance Sector holdings (HF Sector Aggregate) relative to the Sector Market Portfolio (Sector Aggregate). HF Sector Aggregate is position-weighted while Sector Aggregate is capitalization-weighted. This follows the approach of our earlier articles on aggregate and sector-specific hedge fund crowding. Crowded positions are vulnerable to volatility, mass liquidation, and losses; they persistently underperform in some sectors.

Hedge Fund Life and Health Insurance Performance

The figure below plots historical return of HF Life and Health Insurance Aggregate. Factor return is due to systematic (market) risk. Blue area represents positive and gray area represents negative risk-adjusted returns from security selection (αReturn). Crowded bets underperformed the factor portfolio by over 35%:

Chart of the historical factor and idiosyncratic performance of the Hedge Fund Life and Health Insurance Sector Aggregate

Hedge Fund Life and Health Insurance Sector Aggregate Historical Performance

Hedge Fund Life and Health Insurance Risk-Adjusted Performance

The risk-adjusted return from security selection (αReturn) of HF Sector Aggregate is the return it would have generated if markets were flat – all market effects on performance have been eliminated. This is the idiosyncratic performance of the crowded portfolio. Crowded bets in this sector are especially dangerous, given their propensity to disappoint:

Chart of the historical security selection (stock picking) performance of the Hedge Fund Life and Health Insurance Sector Aggregate

Hedge Fund Life and Health Insurance Sector Aggregate Historical Security Selection Performance

Crowded Hedge Fund Life and Health Insurance Ideas

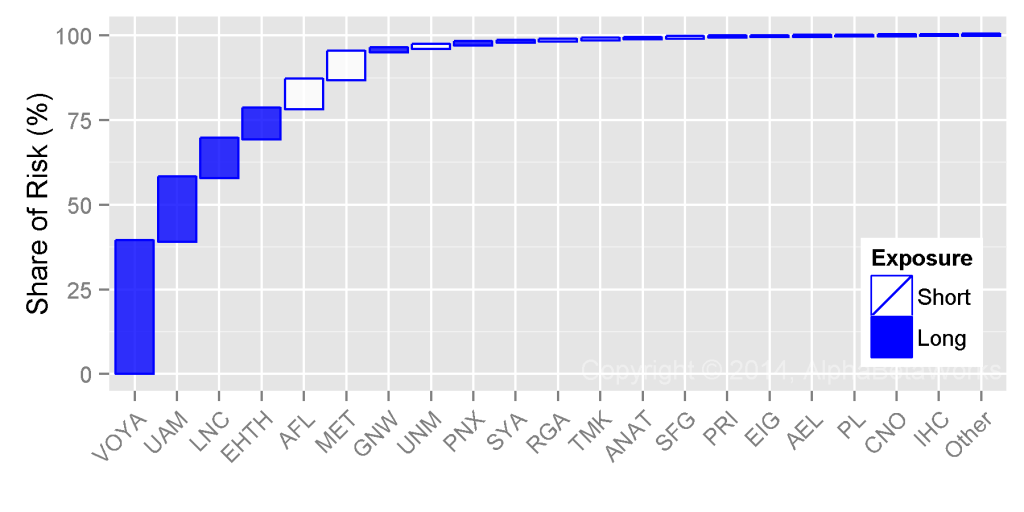
The following stocks contributed most to the relative residual (security-specific) risk of the HF Sector Aggregate as of Q3 2014. Blue bars represent long (overweight) exposures relative to Sector Aggregate. White bars represent short (underweight) exposures. Bar height represents contribution to relative stock-specific risk:

Chart of the contribution to the residual (stock-specific) risk of the crowded hedge fund Life and Health Insurance Sector bets

Crowded Hedge Fund Life and Health Insurance Sector Bets

The following table contains detailed data on these crowded ideas:

Exposure (%) Net Exposure Share of Risk (%)
HF Sector Aggr. Sector Aggr. % $mil Days of Trading
VOYA Voya Financial, Inc. 29.79 5.83 23.96 375.4 4.5 39.08
UAM Universal American Corp. 8.73 0.39 8.34 130.7 123.5 18.76
LNC Lincoln National Corporation 23.20 8.45 14.75 231.2 1.9 11.48
EHTH eHealth, Inc. 3.55 0.26 3.29 51.6 8.9 8.98
AFL Aflac Incorporated 1.05 15.94 -14.88 -233.2 -1.6 8.52
MET MetLife, Inc. 12.56 36.31 -23.75 -372.1 -1.1 8.15
GNW Genworth Financial, Inc. Class A 5.55 3.93 1.62 25.4 0.3 1.04
UNM Unum Group 0.92 5.29 -4.37 -68.5 -1.0 0.97
PNX Phoenix Companies, Inc. 1.59 0.19 1.39 21.9 9.5 0.87
SYA Symetra Financial Corporation 3.75 1.63 2.12 33.1 3.6 0.42
RGA Reinsurance Group of America, Incorporat 0.55 3.32 -2.76 -43.3 -1.4 0.28
TMK Torchmark Corporation 0.00 4.13 -4.13 -64.7 -1.5 0.27
ANAT American National Insurance Company 0.00 1.82 -1.82 -28.6 -17.4 0.27
SFG StanCorp Financial Group, Inc. 0.00 1.64 -1.64 -25.6 -1.8 0.24
PRI Primerica, Inc. 0.00 1.58 -1.58 -24.8 -1.7 0.16
EIG Employers Holdings, Inc. 1.06 0.37 0.69 10.8 4.1 0.10
AEL American Equity Investment Life Holding 0.13 1.03 -0.91 -14.2 -0.7 0.09
PL Protective Life Corporation 2.41 3.32 -0.91 -14.2 -0.3 0.08
CNO CNO Financial Group, Inc. 3.11 2.13 0.98 15.4 0.6 0.07
IHC Independence Holding Company 0.60 0.14 0.46 7.2 42.1 0.05
Other Positions 0.03 0.11
Total 100.00

The table above shows that, while EHTH was neither the highest contributor to risk nor the most illiquid, it was one of the top bets in each category. When the bad news came, its value halved. VOYA, UAM, and LNC, the other large and illiquid bets, are also at risk. Even when a positive catalyst arrives, impatient hedge fund holders may sell on the news, muting any upside. Whether or not investors choose to steer clear of crowded names, they must monitor them. With proper data, this attention to crowding can prevent “unexpected” volatility.

Conclusion

eHealth illustrates the vulnerability of crowded and illiquid positions to disorderly liquidation. eHealth was especially dangerous, given the tendency of crowded hedge fund life and health insurance ideas to disappoint. Investors armed with hedge fund crowding insights could have avoided these losses.

The information herein is not represented or warranted to be accurate, correct, complete or timely.
Past performance is no guarantee of future results.
Copyright © 2012-2015, AlphaBetaWorks, a division of Alpha Beta Analytics, LLC. All rights reserved.
Content may not be republished without express written consent.

Hedge Fund Crowding Costs – SanDisk

SanDisk (SNDK) was down 14% following a disappointing pre-announcement. This is a common occurrence for crowded ideas: SanDisk is the most crowded hedge fund bet in its sector, and crowded hedge fund Electronic Components picks tend to do poorly. These events illustrate crowding costs, particularly in the areas where hedge funds display a persistent lack of skill.

This piece analyzes hedge fund Electronic Components sector holdings (HF Sector Aggregate) relative to the sector market portfolio (Sector Aggregate). HF Sector Aggregate is position-weighted while Sector Aggregate is capitalization-weighted. We follow the approach of our earlier articles on aggregate and sector-specific hedge fund crowding. Crowded positions are vulnerable to volatility, mass liquidation, and losses. In some sectors crowded positions persistently underperform.

Hedge Fund Electronic Components Performance

The figure below plots historical return of HF Sector Aggregate. Factor return is due to systematic (market) risk. Blue area represents positive and gray area represents negative risk-adjusted returns from security selection (αReturn):

Chart of the components of Hedge Fund Electronic Components Sector Aggregate historical performance

Hedge Fund Electronic Components Sector Aggregate Historical Performance

Hedge Fund Electronic Components Risk-Adjusted Performance

The risk-adjusted return from security selection (αReturn) of HF Sector Aggregate is the return it would have generated if markets were flat. This is the idiosyncratic performance of the crowded portfolio. Adjusted for market returns, crowded bets have lost 24% since 2004:

Chart of the risk-adjusted return from security selection of the Hedge Fund Electronic Components Sector Aggregate

Hedge Fund Electronic Components Sector Aggregate Historical Risk-Adjusted Performance

Crowded Hedge Fund Electronic Components Bets

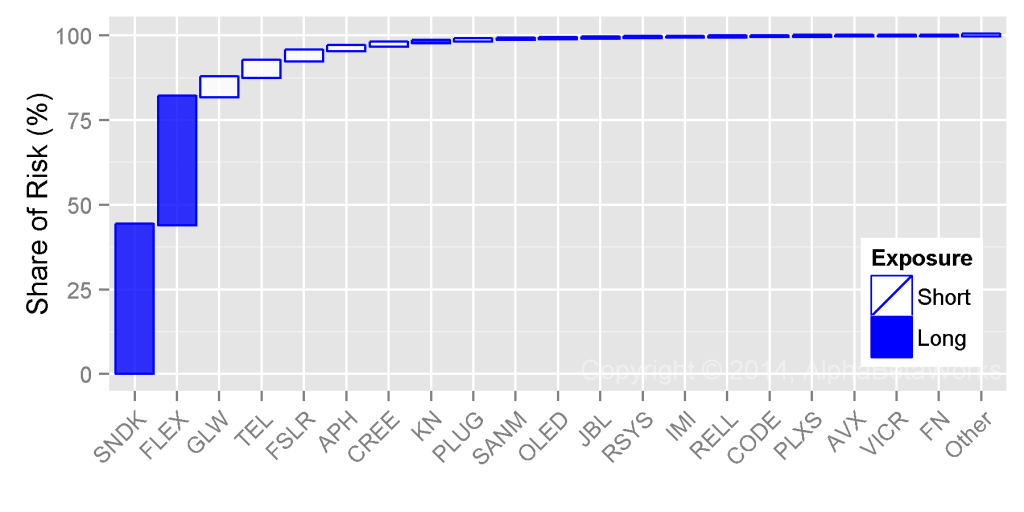
The following stocks contributed most to the relative residual (security-specific) risk of the HF Sector Aggregate as of 2014-09-30. Blue bars represent long (overweight) exposures relative to Sector Aggregate. White bars represent short (underweight) exposures. Bar height represents contribution to relative stock-specific risk:

Chart of the recent crowded stock-specific (idiosyncratic) Hedge Fund Electronic Components Sector bets

Crowded Hedge Fund Electronic Components Sector Bets

The following table contains detailed data on these crowded bets:

Exposure (%) Net Exposure Share of Risk (%)
HF Sector Aggr. Sector Aggr. % $mil Days of Trading
SNDK SanDisk Corporation 40.46 16.60 23.87 584.0 1.7 43.86
FLEX Flextronics International Ltd. 35.31 4.59 30.73 751.9 13.7 37.92
GLW Corning Incorporated 2.68 18.87 -16.19 -396.1 -2.0 5.73
TEL TE Connectivity Ltd. 0.02 17.10 -17.07 -417.9 -3.0 4.84
FSLR First Solar, Inc. 1.38 4.98 -3.60 -88.1 -0.7 3.00
APH Amphenol Corporation Class A 1.31 11.86 -10.55 -258.3 -3.4 1.30
CREE Cree, Inc. 0.82 3.70 -2.88 -70.5 -0.8 1.02
KN Knowles Corp. 3.51 1.70 1.81 44.3 1.1 0.58
PLUG Plug Power Inc. 0.03 0.58 -0.55 -13.5 -0.6 0.47
SANM Sanmina-SCI Corporation 0.00 1.30 -1.30 -31.9 -1.9 0.23
OLED Universal Display Corporation 0.27 1.15 -0.88 -21.5 -1.3 0.17
JBL Jabil Circuit, Inc. 1.67 3.05 -1.38 -33.7 -0.5 0.12
RSYS RadiSys Corporation 0.75 0.07 0.67 16.5 60.7 0.11
IMI Intermolecular, Inc. 0.91 0.08 0.82 20.1 145.2 0.10
RELL Richardson Electronics, Ltd. 1.62 0.09 1.53 37.5 162.9 0.08
CODE Spansion Inc. Class A 0.21 1.05 -0.84 -20.7 -0.3 0.06
PLXS Plexus Corp. 0.00 0.94 -0.94 -23.0 -2.9 0.05
AVX AVX Corporation 0.00 1.69 -1.69 -41.3 -13.2 0.04
VICR Vicor Corporation 0.70 0.19 0.51 12.5 9.9 0.04
FN Fabrinet 0.00 0.39 -0.39 -9.5 -2.8 0.04
Other Positions 0.19 0.23
Total 100.00

Conclusion

SanDisk illustrates the vulnerability to crowded names to mass liquidation by impatient investors. In general, crowded Electronic Component stocks tend to disappoint and hedge funds do even worse in other sectors.

Instead of blindly following hedge funds into popular technology names, investors should be wary of these ideas. Even excellent managers are seldom skilled in all areas and tend to generate the bulk of their active returns from a few specific skills.

The information herein is not represented or warranted to be accurate, correct, complete or timely.
Past performance is no guarantee of future results.
Copyright © 2012-2015, AlphaBetaWorks, a division of Alpha Beta Analytics, LLC. All rights reserved.
Content may not be republished without express written consent.