
In recent articles we discussed shared long bets among U.S. hedge funds – a phenomenon called “crowding” – without quantifying its consequences. Crowding is costly to investors, fund managers, and allocators. A prime example of this is the Energy Sector:
- Over the past 10 years the aggregate hedge fund long energy portfolio (HF Energy Aggregate) delivered negative risk-adjusted returns.
- Since the energy cycle peaked in mid-2008, HF Energy Aggregate took more risk than the market energy portfolio (Market Energy Aggregate), yet it underperformed.
- Since mid-2008, HF Energy Aggregate has lost 20% on a risk-adjusted basis.
Hedge Fund Energy Crowding
Our previous article discussed hedge fund (HF) energy herding, We created an aggregate position-weighted portfolio (HF Energy Aggregate) consisting of all long energy equity positions reported by over 400 U.S. hedge funds with medium to low turnover. We then evaluated HF Energy Aggregate’s risk relative to the capitalization-weighted portfolio of energy equities (Market Energy Aggregate) using AlphaBetaWorks’ Statistical Equity Risk Model. The exercise revealed factor (systematic/market) and residual (idiosyncratic/security-specific) crowding.
We mentioned that consensus hedge fund long energy bets tend to disappoint and carry higher risk, but we did not quantify these costs.
Crowded Energy Stocks Underperform
Hedge fund crowding hurts performance. HF Energy Aggregate had poor returns following the peak of the last energy cycle in 2008, even without taking into account its higher risk:
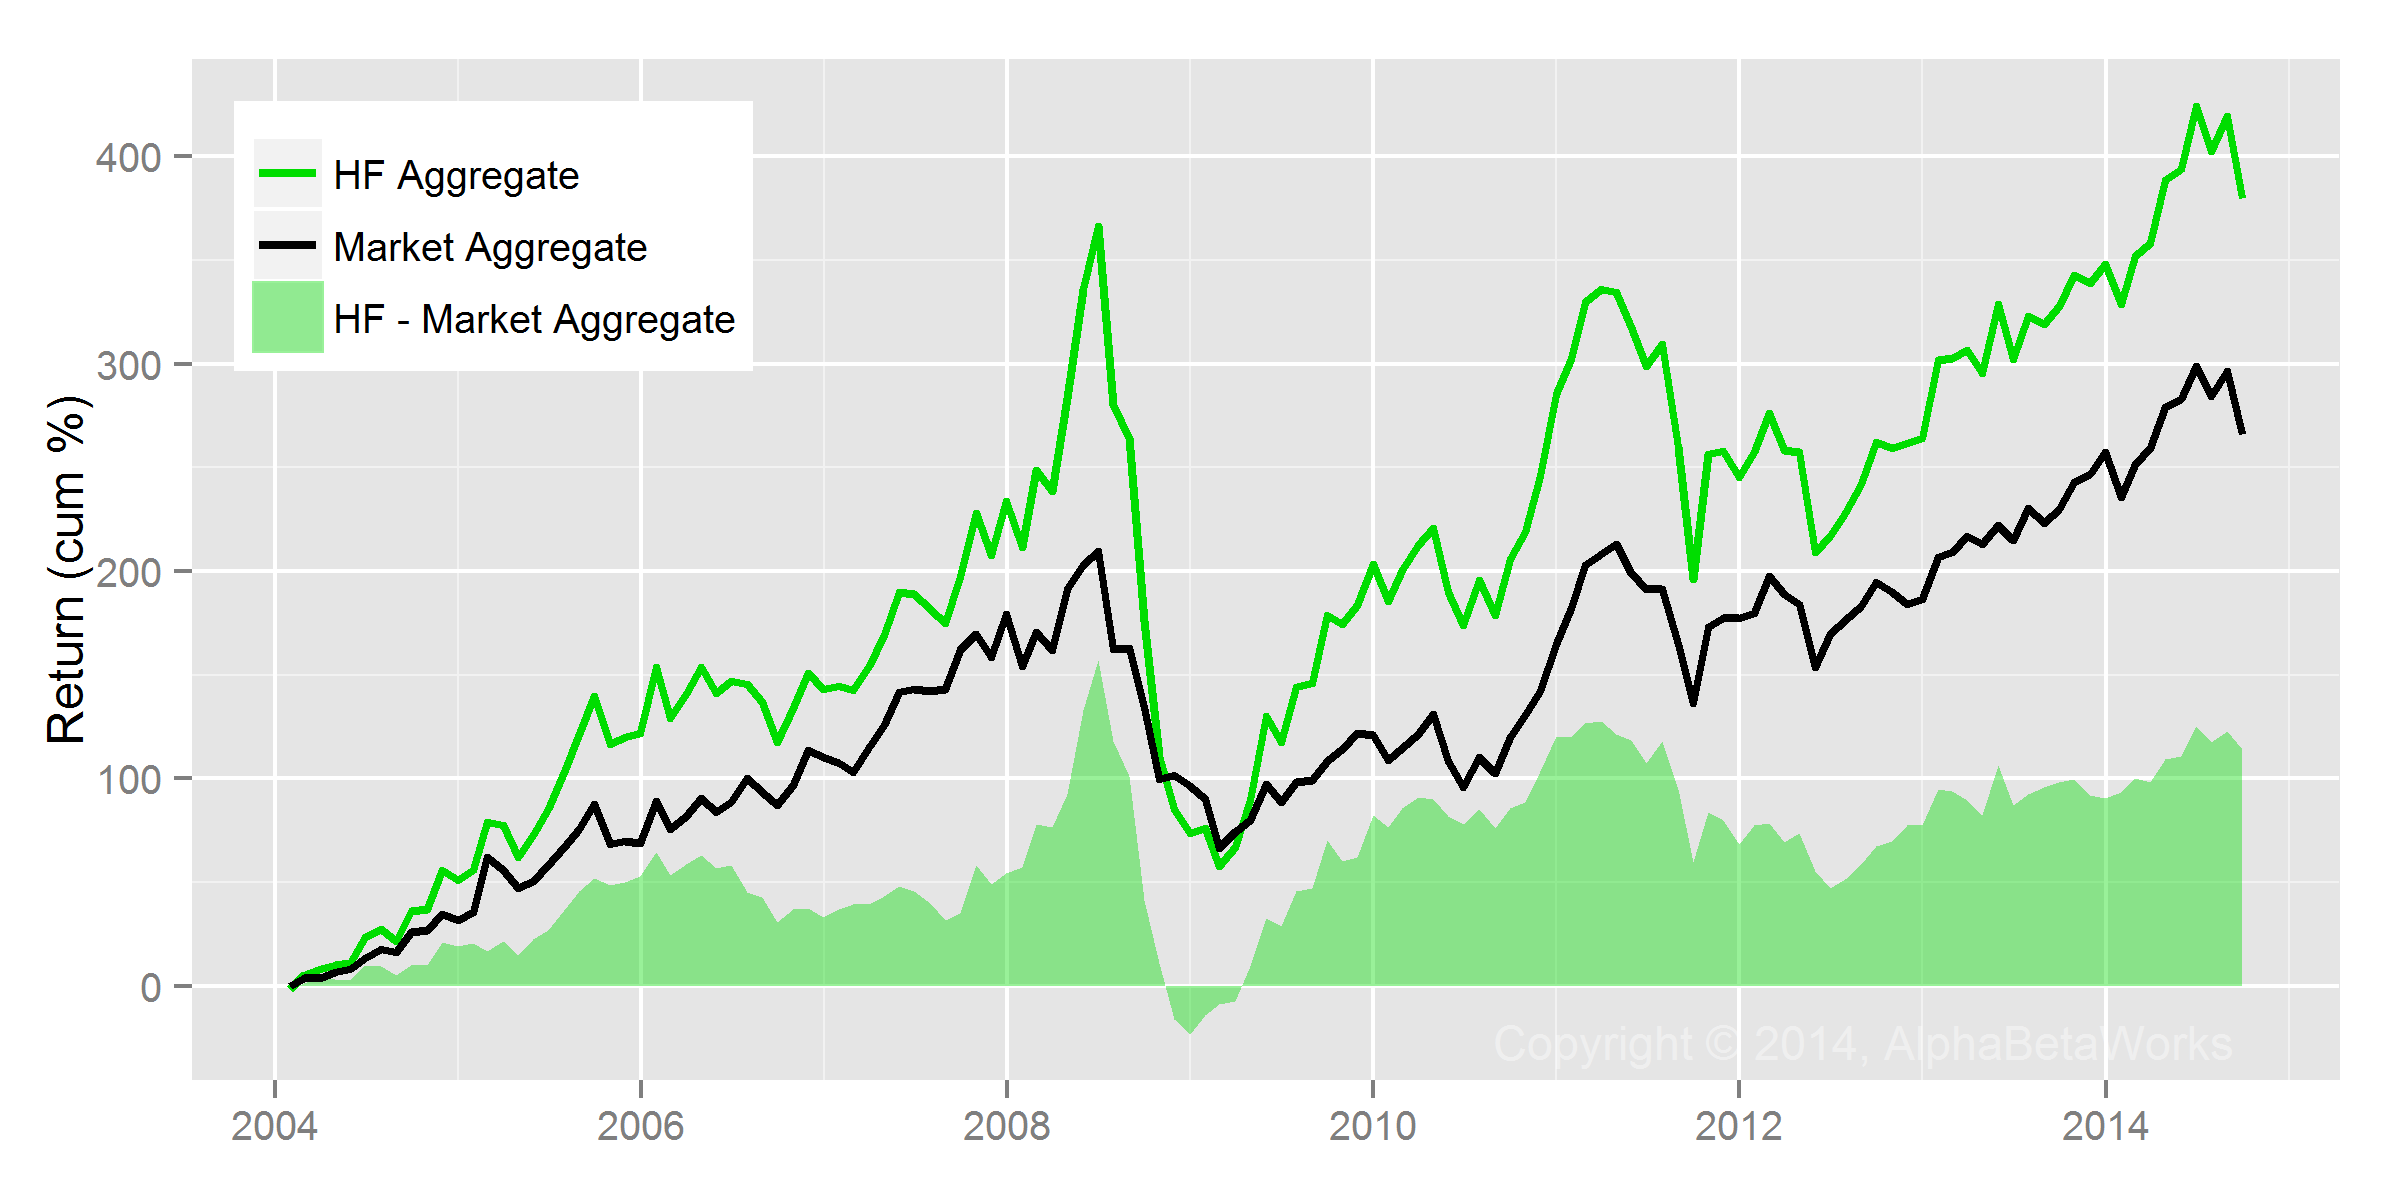
Historical Return for Hedge Fund Energy Aggregate vs. Market Energy Aggregate
The spectacular relative performance of HF Energy Aggregate during the commodity boom and the disastrous relative performance in the subsequent commodity crash suggest herding into higher-risk stocks. This is consistent with the aggregate systematic crowding of hedge funds towards higher market beta.
Crowded Energy Stocks Are Riskier
HF Energy Aggregate tends to carry approximately 20% more market exposure than Market Energy Aggregate:

Hedge Fund Energy Aggregate’s Exposure to Significant Risk Factors
Crowded Energy Stocks Have Poor Risk-Adjusted Returns
Due to the higher risk of HF Energy Aggregate, its residual return (risk-adjusted performance due to security selection) is even worse. Investors would have made approximately 20% more over the past 10 years holding an ETF portfolio with similar factor risk (factor portfolio):
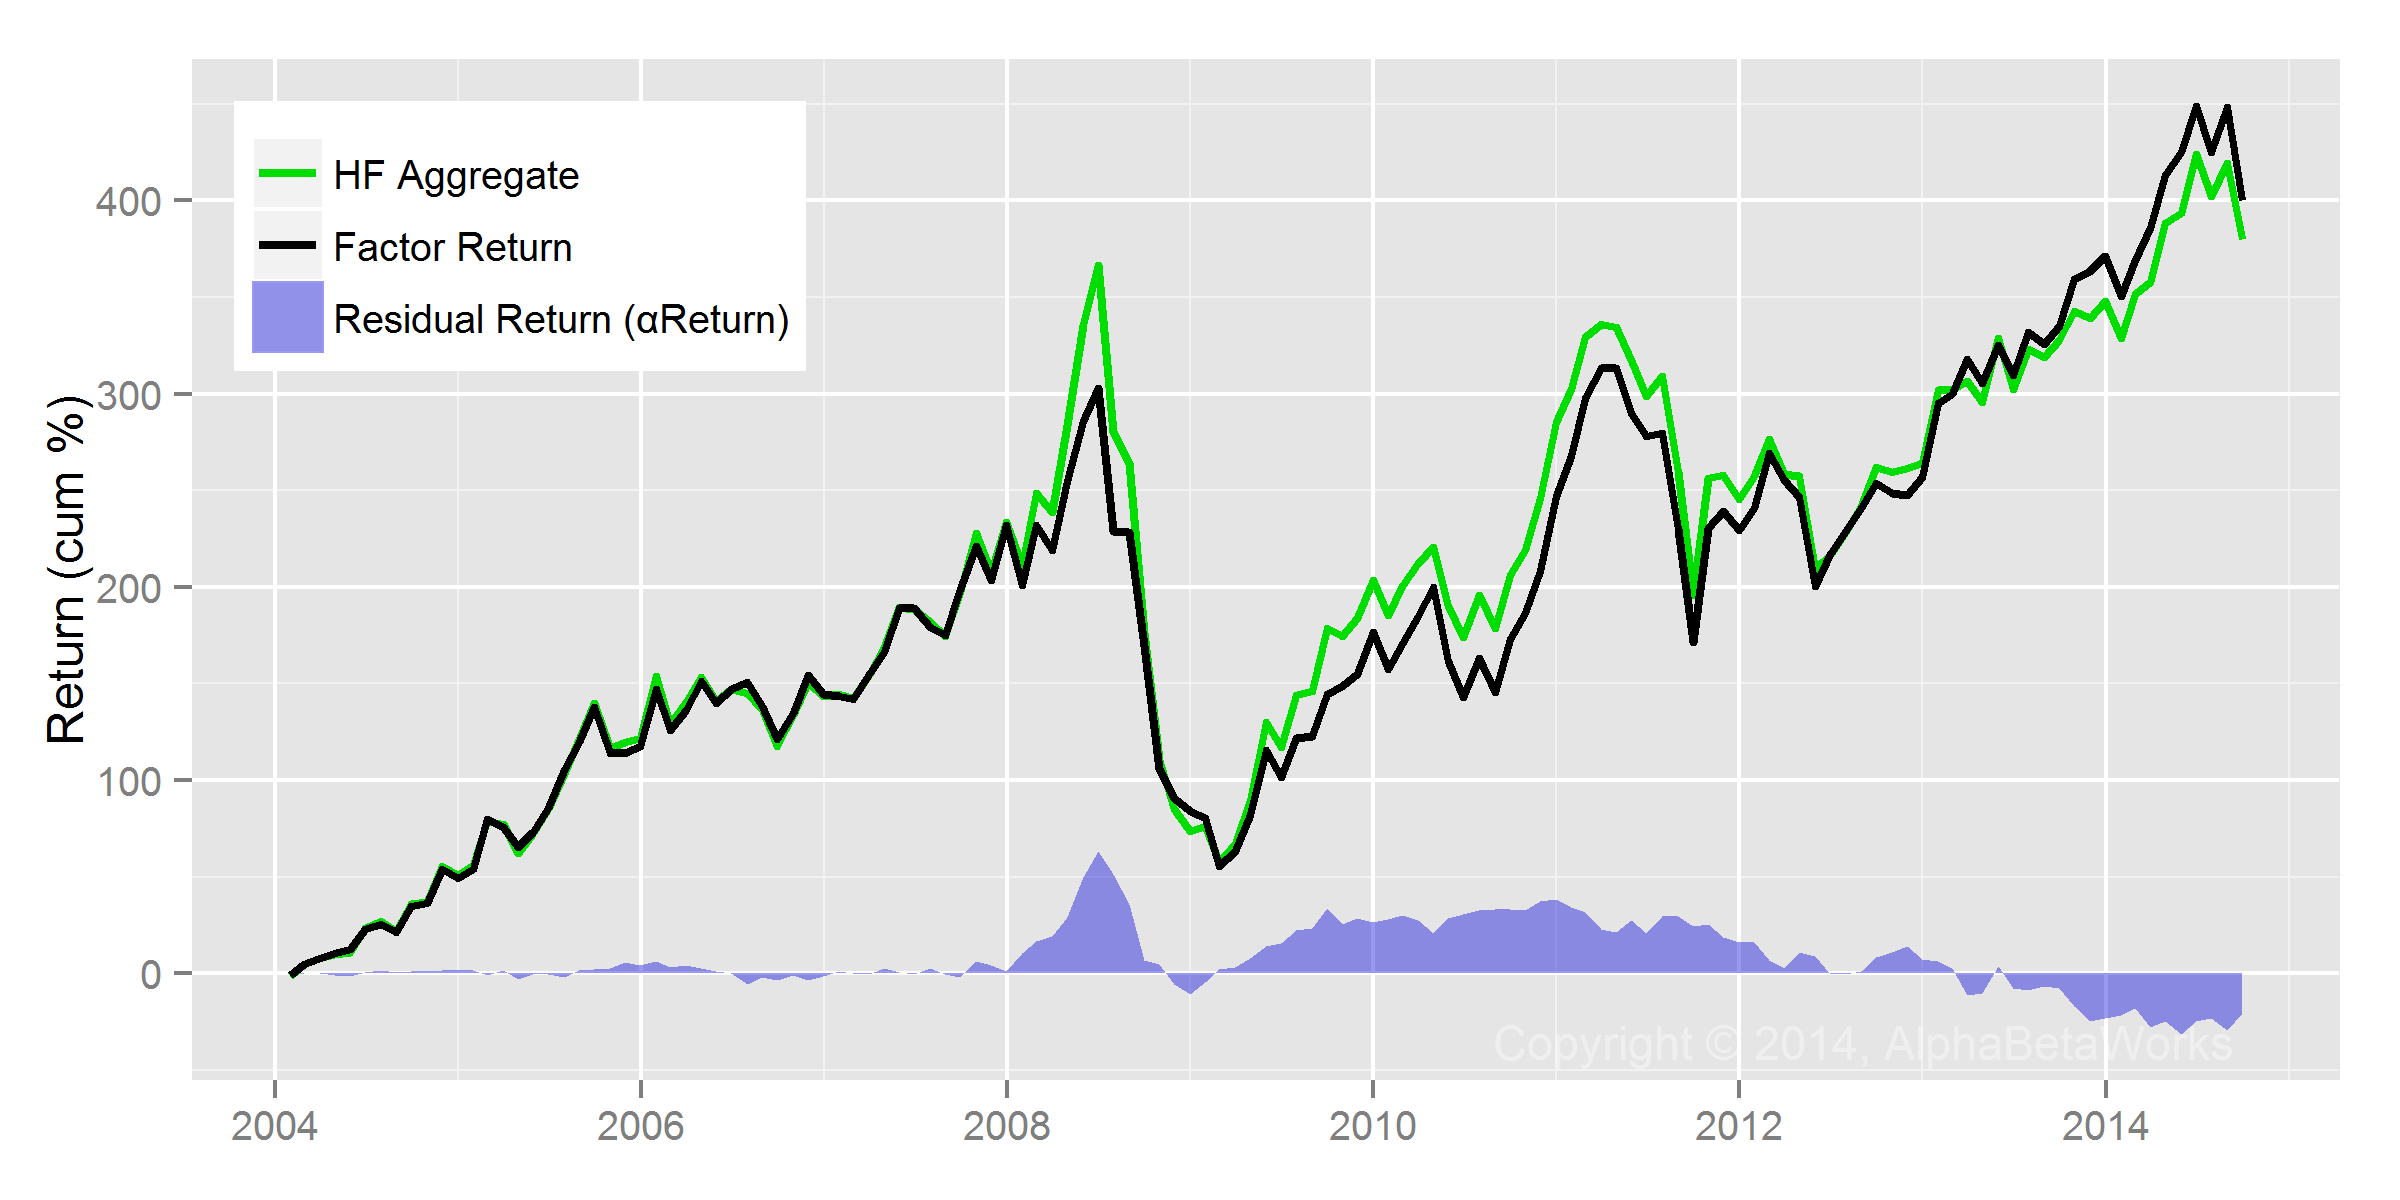
Historical Hedge Fund Energy Aggregate Factor and Residual Returns
Investors would have also made approximately 20% more since the mid-2008 energy cycle peak with this factor portfolio:

Historical Hedge Fund Energy Aggregate Factor and Residual Returns since Cycle Peak
Summary
- Hedge Fund Energy Aggregate tends to have higher risk than Market Energy Aggregate.
- Crowded Hedge Fund Energy stocks tend to generate negative risk-adjusted returns.
- Crowded Hedge Fund Energy stocks tend to outperform in a boom and underperform in a bust: Since mid-2008 energy cycle peak, HF Energy Aggregate underperformed nominally and lost 20% on a risk-adjusted basis.


