Category Archives: Hedge Funds

Pershing Square’s Finance Sector Security Selection Performance

Pershing square has a phenomenal track record of stock picking. Over the past 10 years, it has generated approximately 200% risk-adjusted return from security selection in its long (13F) portfolio. If market were flat for the past 10 years, the portfolio would have gained approximately 200%. We call this risk-adjusted return αReturn:

Chart of the Security Selection Return of Pershing Square's Long Portfolio

Pershing Square Security Selection Return – Long Positions

The performance of the firm’s finance sector stock picks is almost as impressive, just slightly less strong than the overall portfolio and less consistent. Over the past 10 years Pershing Square’s long finance sector portfolio generated approximately 150% risk-adjusted return from stock picking (αReturn):

Chart of the Security Selection Return of  Pershing Square's Long Finance Sector Portfolio

Pershing Square Finance Sector Portfolio Security Selection Return – Long Positions

This is encouraging for the investors in Fannie Mae (FNMA) and Freddie Mac (FMCC). Bill Ackman has invested in the companies and sees them as the most interesting opportunity since General Growth Properties (GGP) in 2008.

Greenlight’s Long Equity Position Sizing

Greenlight’s top positions generally aren’t its best ones. It is common to assume that the top positions of skilled investors are their best ideas, but this is not always the case. If Greenlight sized all positions equally for the past 10 years, the risk adjusted return of long portfolio would have been approximately 20% higher.

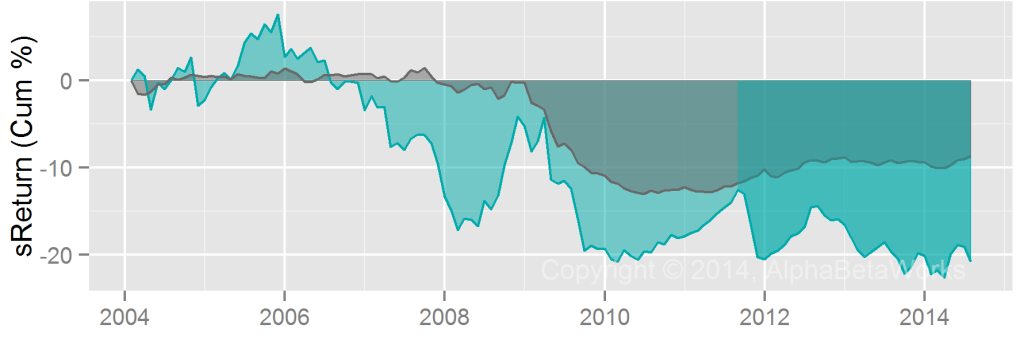
We can’t know for sure whether Greenlight Capital can’t identify their best stock picks, or can’t scale them. What we do know is that the risk-adjusted return of their average position is higher than the risk-adjusted return of their top position. AlphaBetaWorks defines this return – the difference in stock picking (αReturn) between the actual portfolio and equal-size portfolio – as sReturn. For Greenlight, it is negative:

The Chart of Position Sizing Return for Long Positions of Greenlight Capital (13F Filings)

Greenlight Capital Position Sizing Return – Long Positions

When a successful manager’s fund grows, they may have trouble scaling their best picks. Their largest positions become the names they can, rather than prefer to, buy the most of.

Paulson & Co Energy Sector Security Selection Skill

One should be careful when handling Paulson’s energy picks.

A portfolio of Paulson’s long (13F) energy positions has lost ~50% on a risk-adjusted basis. ETFs with the same market and energy sector exposures as the energy portfolio have outperformed it. The historical security selection (stock picking) performance of Paulson’s 13F positions is the blue αReturn on the following chart:

Chart of the Security Selection (Stock Picking) Performance of the Energy Sector Portfolio of Paulson & Co, Obtained From 13F Filings

Paulson & Co Energy Sector Security Selection Return – 13F Positions

The energy sector stock picking has stabilized of late, but there is probably a stronger case for going short these positions, than long.

The Trend Towards U.S. Hedge Fund Passivity

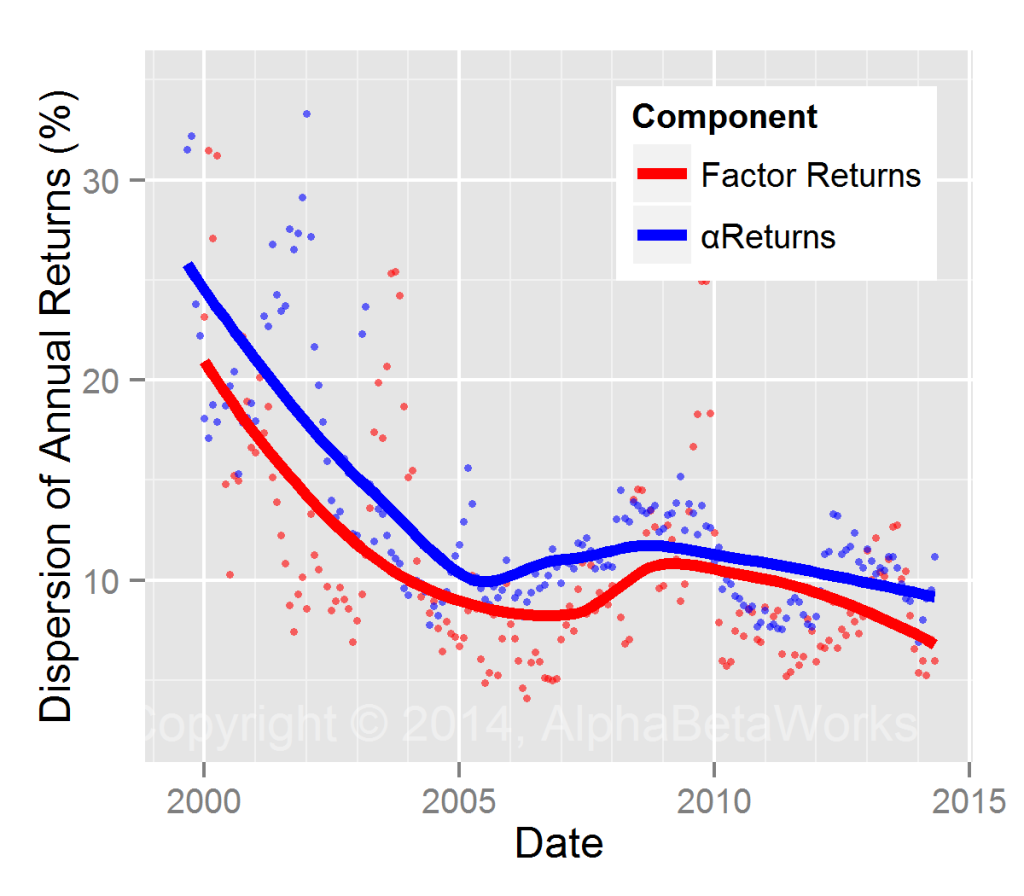
We charted the historical cross sectional standard deviation of factor (systematic) and α (security selection) returns for U.S. hedge funds:

US Hedge Fund Long Portfolio Performance Dispersion

US Hedge Fund Long Portfolio Performance Dispersion

A surprising finding is that, even in midst of the 2008-2009 market volatility spike, the long positions of U.S. hedge funds were less differentiated from each other that they had been in the relatively lower-volatility regime of 2003-2004.