
Our earlier articles discussed how some smart beta strategies turn out to be merely high beta strategies and how others actively time the market. We also showed that, for the majority of smart beta ETFs, returns are mostly attributable to the traditional dumb Market and Sector Factors. Consequently, the absolute performance of most smart beta strategies can be substantially captured by sector rotation. We received questions about these studies’ focus on absolute performance: The attribution of absolute performance to the Market and Sector factors tells little about tracking error and relative variance. Perhaps smart beta volatility is attributable to dumb factors, but smart beta tracking error is not?
This article addresses the above criticism and analyzes smart beta tracking error rather than (absolute) volatility. The results hold: Though some smart beta ETFs do provide valuable exposures to idiosyncratic factors, most primarily re-shuffle basic dumb factors. Whether one considers their absolute or relative performance, most smart beta equity ETFs are largely sector rotation strategies in disguise. Consequently, investors and allocators must guard against elaborate re-packaging of dumb factors as smart beta and perform rigorous sector and industry analysis of their smart beta allocations. Further, dozens of smart beta strategies can be substantially replicated and blended using simple sector factor portfolios.
Measuring the Influence of Dumb Beta Factors on Smart Beta ETFs
We used the same U.S. Smart Beta ETF dataset as our earlier study of smart beta ETFs’ dumb factor exposures. For each ETF, we estimated monthly positions and then used these positions to calculate portfolio factor exposures for traditional (dumb beta) factors such as Market and Sectors. The ex-ante factor exposures at the end of each month were used to predict the following month’s returns. The correlation between actual and predicted returns relative to the U.S. Equity Market (defined as the iShares Russell 3000 ETF – IWV) quantified the influence of dumb beta factors on smart beta tracking error. The higher the correlation, the more similar a smart beta ETF is to a portfolio of traditional, simple, and dumb systematic risk factors.
The Influence of Market Beta on Smart Beta ETFs
Our simplest test used a single systematic risk factor – Market Beta. Median correlation between predicted and actual relative returns of smart beta ETFs was 0.31:
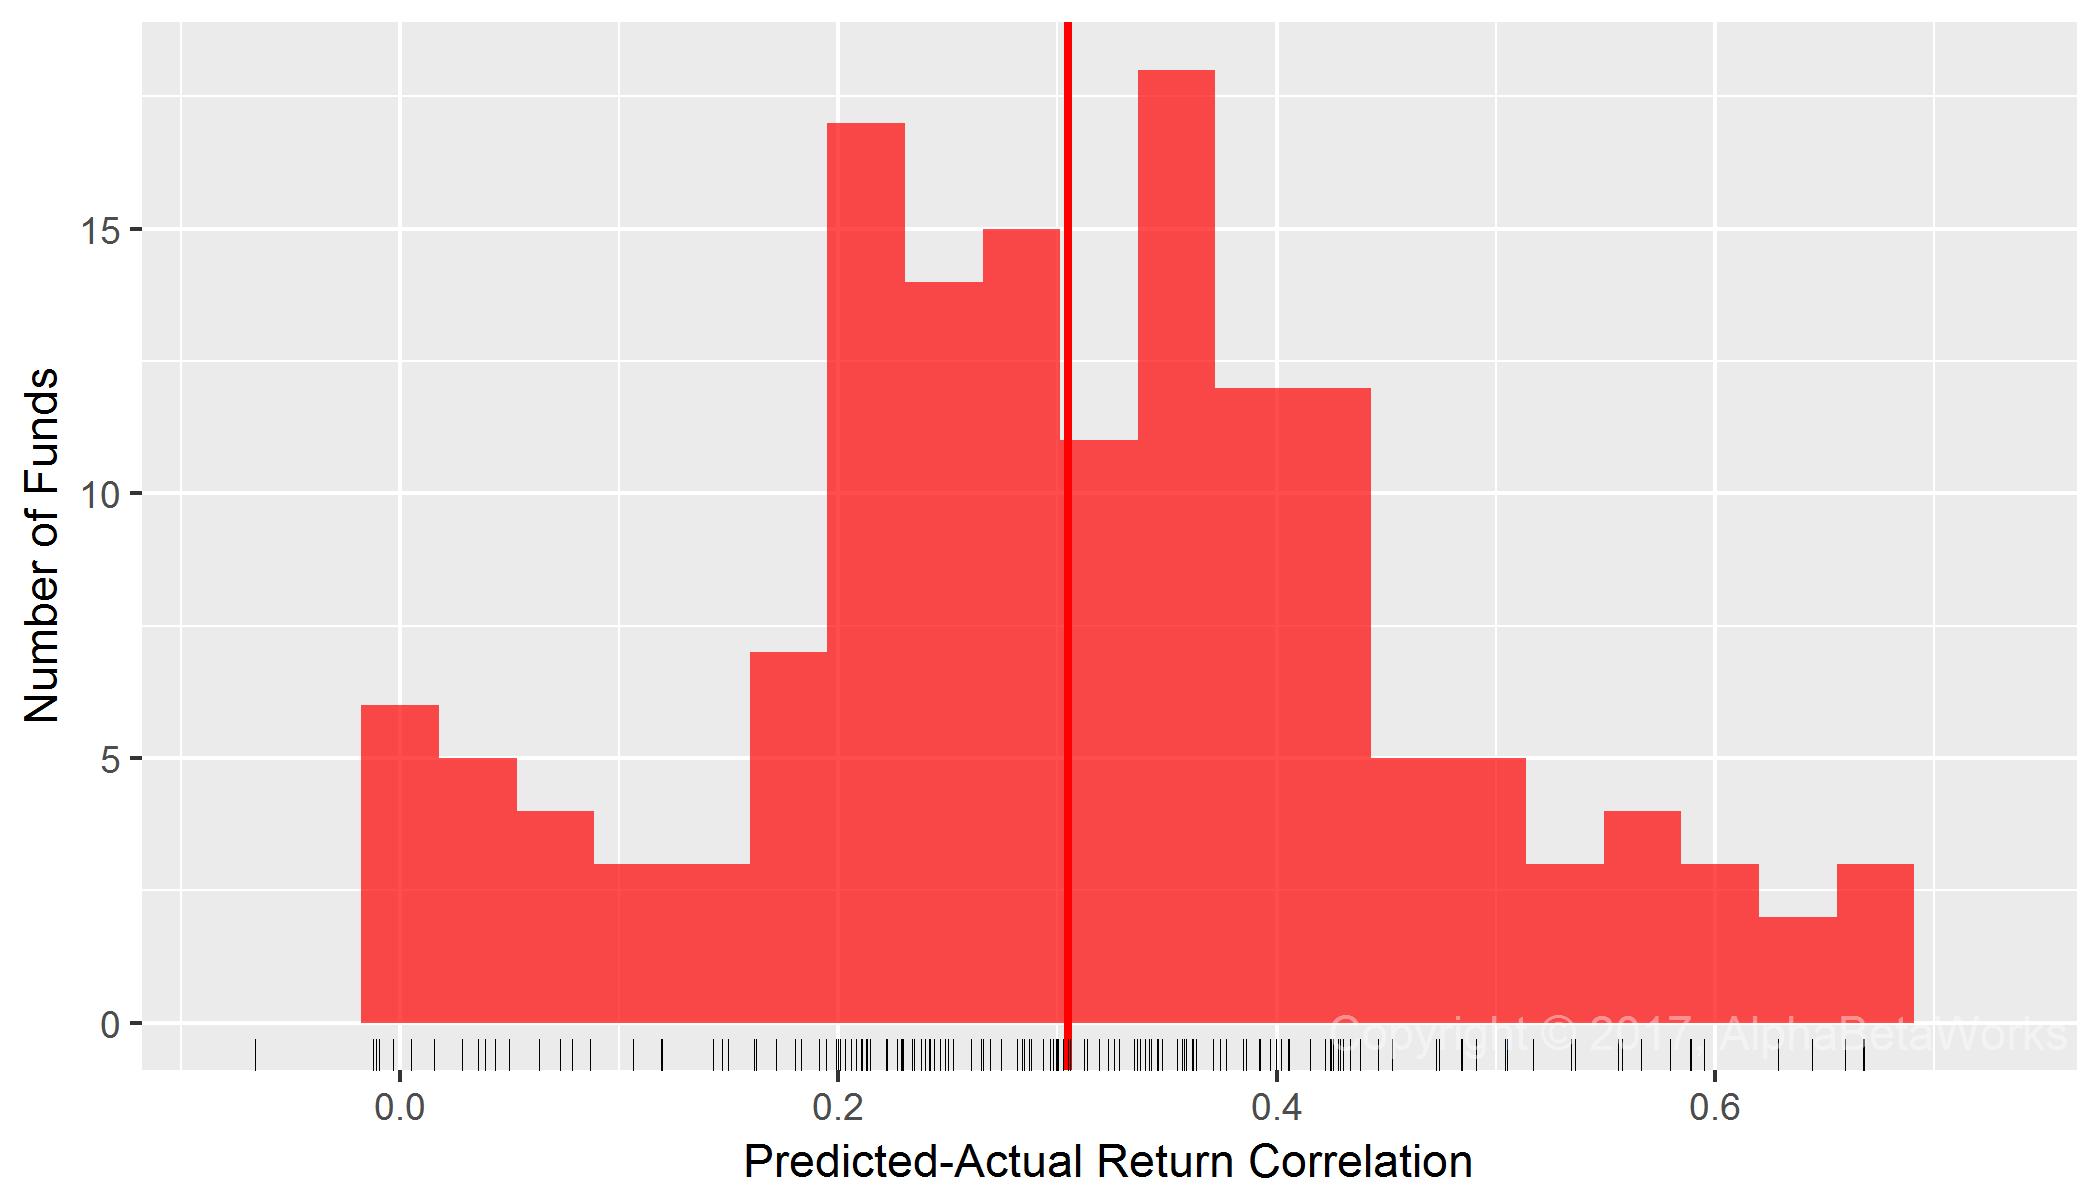
U.S. Smart Beta Equity ETFs: Correlation between predicted relative returns and actual relative returns using a single Market factor
   Min. 1st Qu.  Median    Mean 3rd Qu.    Max.
-0.1089  0.2129  0.3050  0.3096  0.4053  0.8899
The influence of Market Beta on tracking error is much lower than its influence on absolute variance since it only measures relative performance due to deviations from Market’s risk.
The Influence of Market and Sector Betas on Smart Beta ETFs
We next tested a two-factor model that added a Sector Factor. Each security belonged to one of 10 broad sectors (e.g., Energy, Technology). Market and Sector Betas, estimated with robust methods, delivered 0.68 mean and median correlations between predicted and actual relative returns of smart beta ETFs:
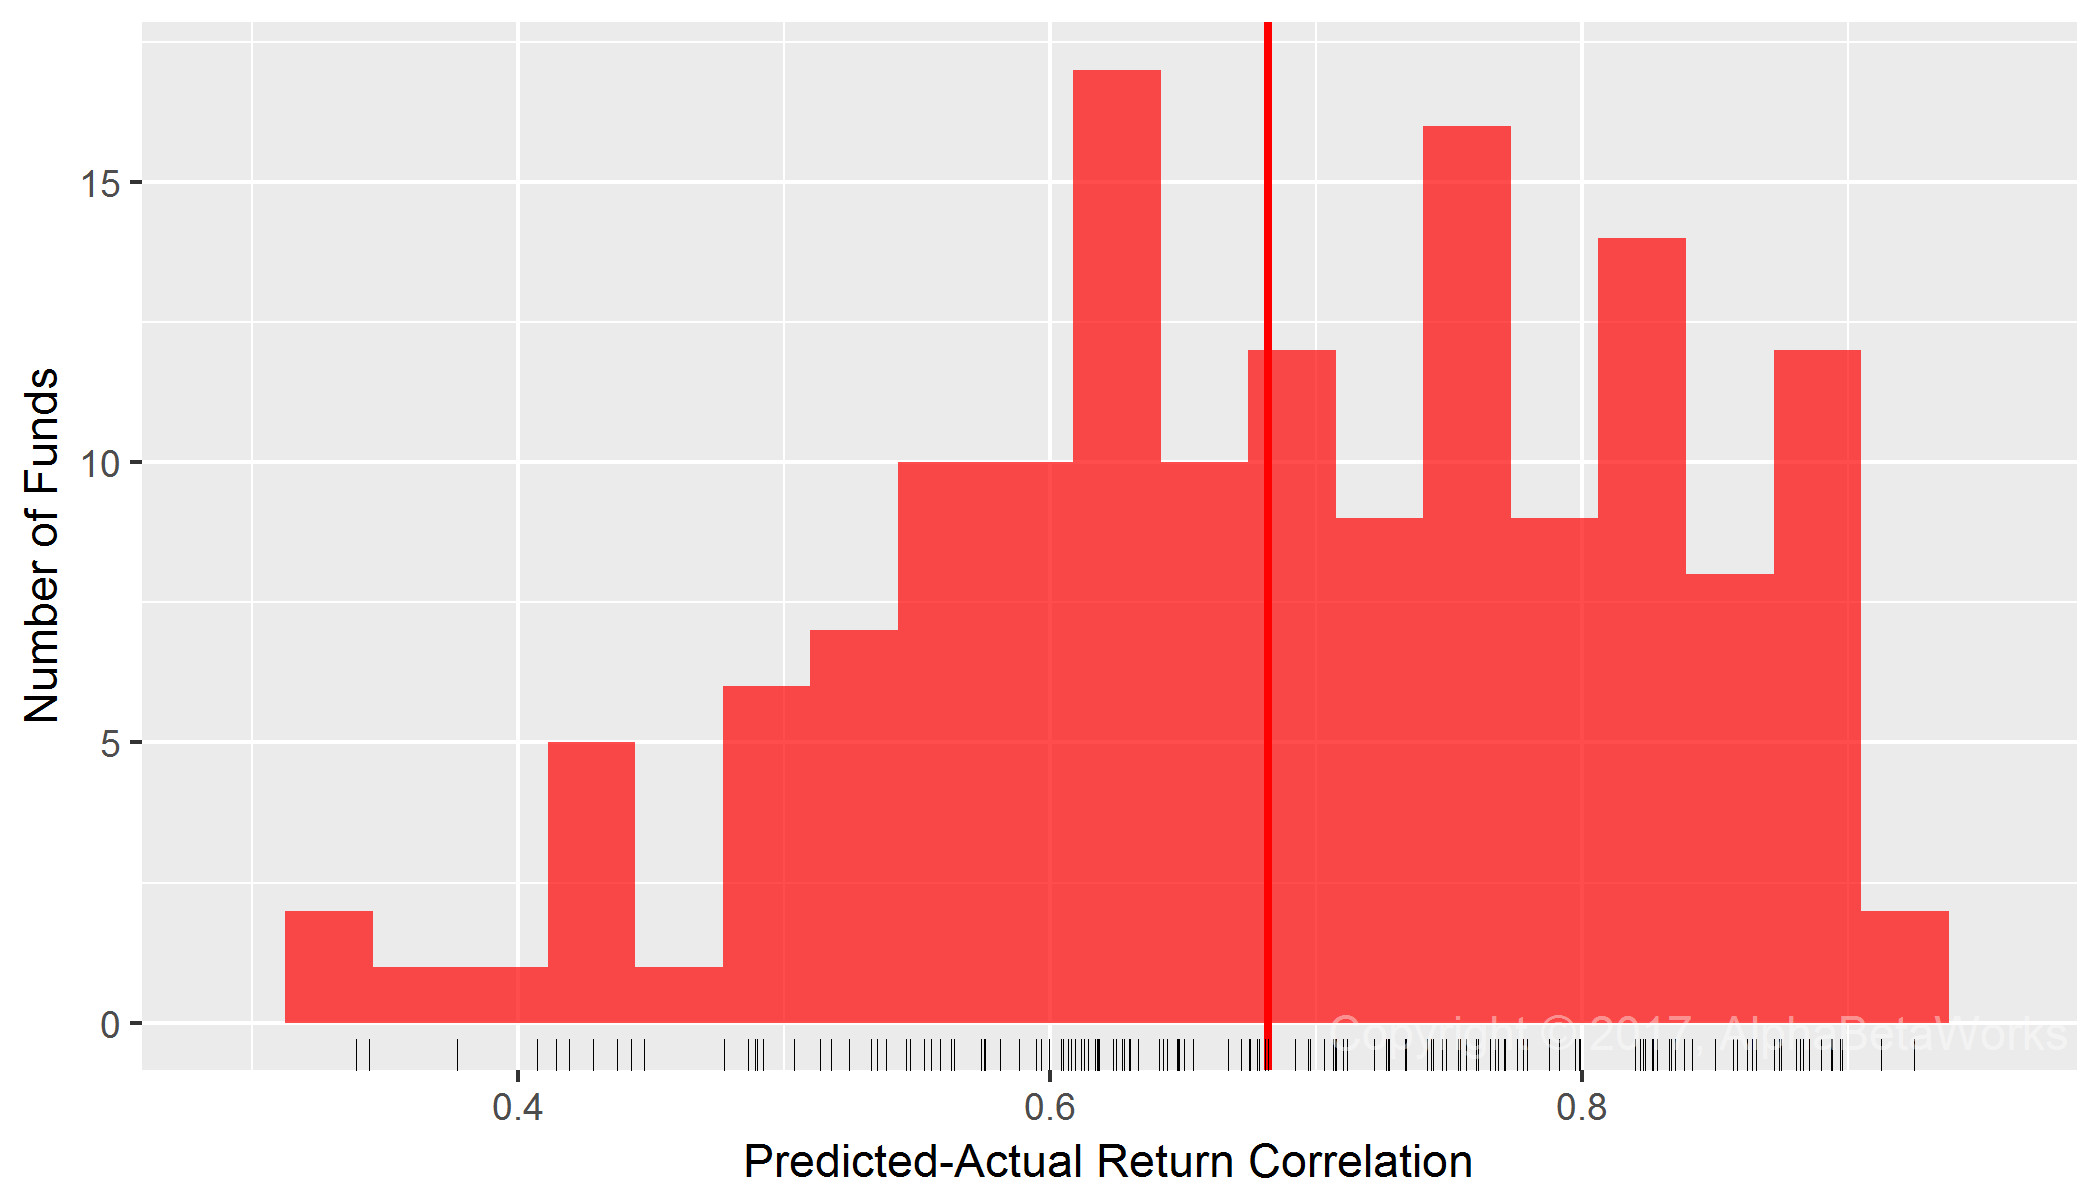
U.S. Smart Beta Equity ETFs: Correlation between predicted relative returns and actual relative returns using Market and Sector factors
  Min. 1st Qu.  Median    Mean 3rd Qu.    Max.
0.0355  0.5983  0.6821  0.6801  0.7981  0.9630
Put differently: For most broad U.S. equity smart beta ETFs, U.S. Market and Sector Betas alone account for approximately half of tracking error and relative variance.
The Influence of all Dumb Factor Betas on Smart Beta ETFs
For the final tests, we added additional dumb factors such as Bonds, Value, and Size. All dumb factor betas delivered 0.74 mean and 0.78 median correlations between predicted and actual relative returns of smart beta ETFs:
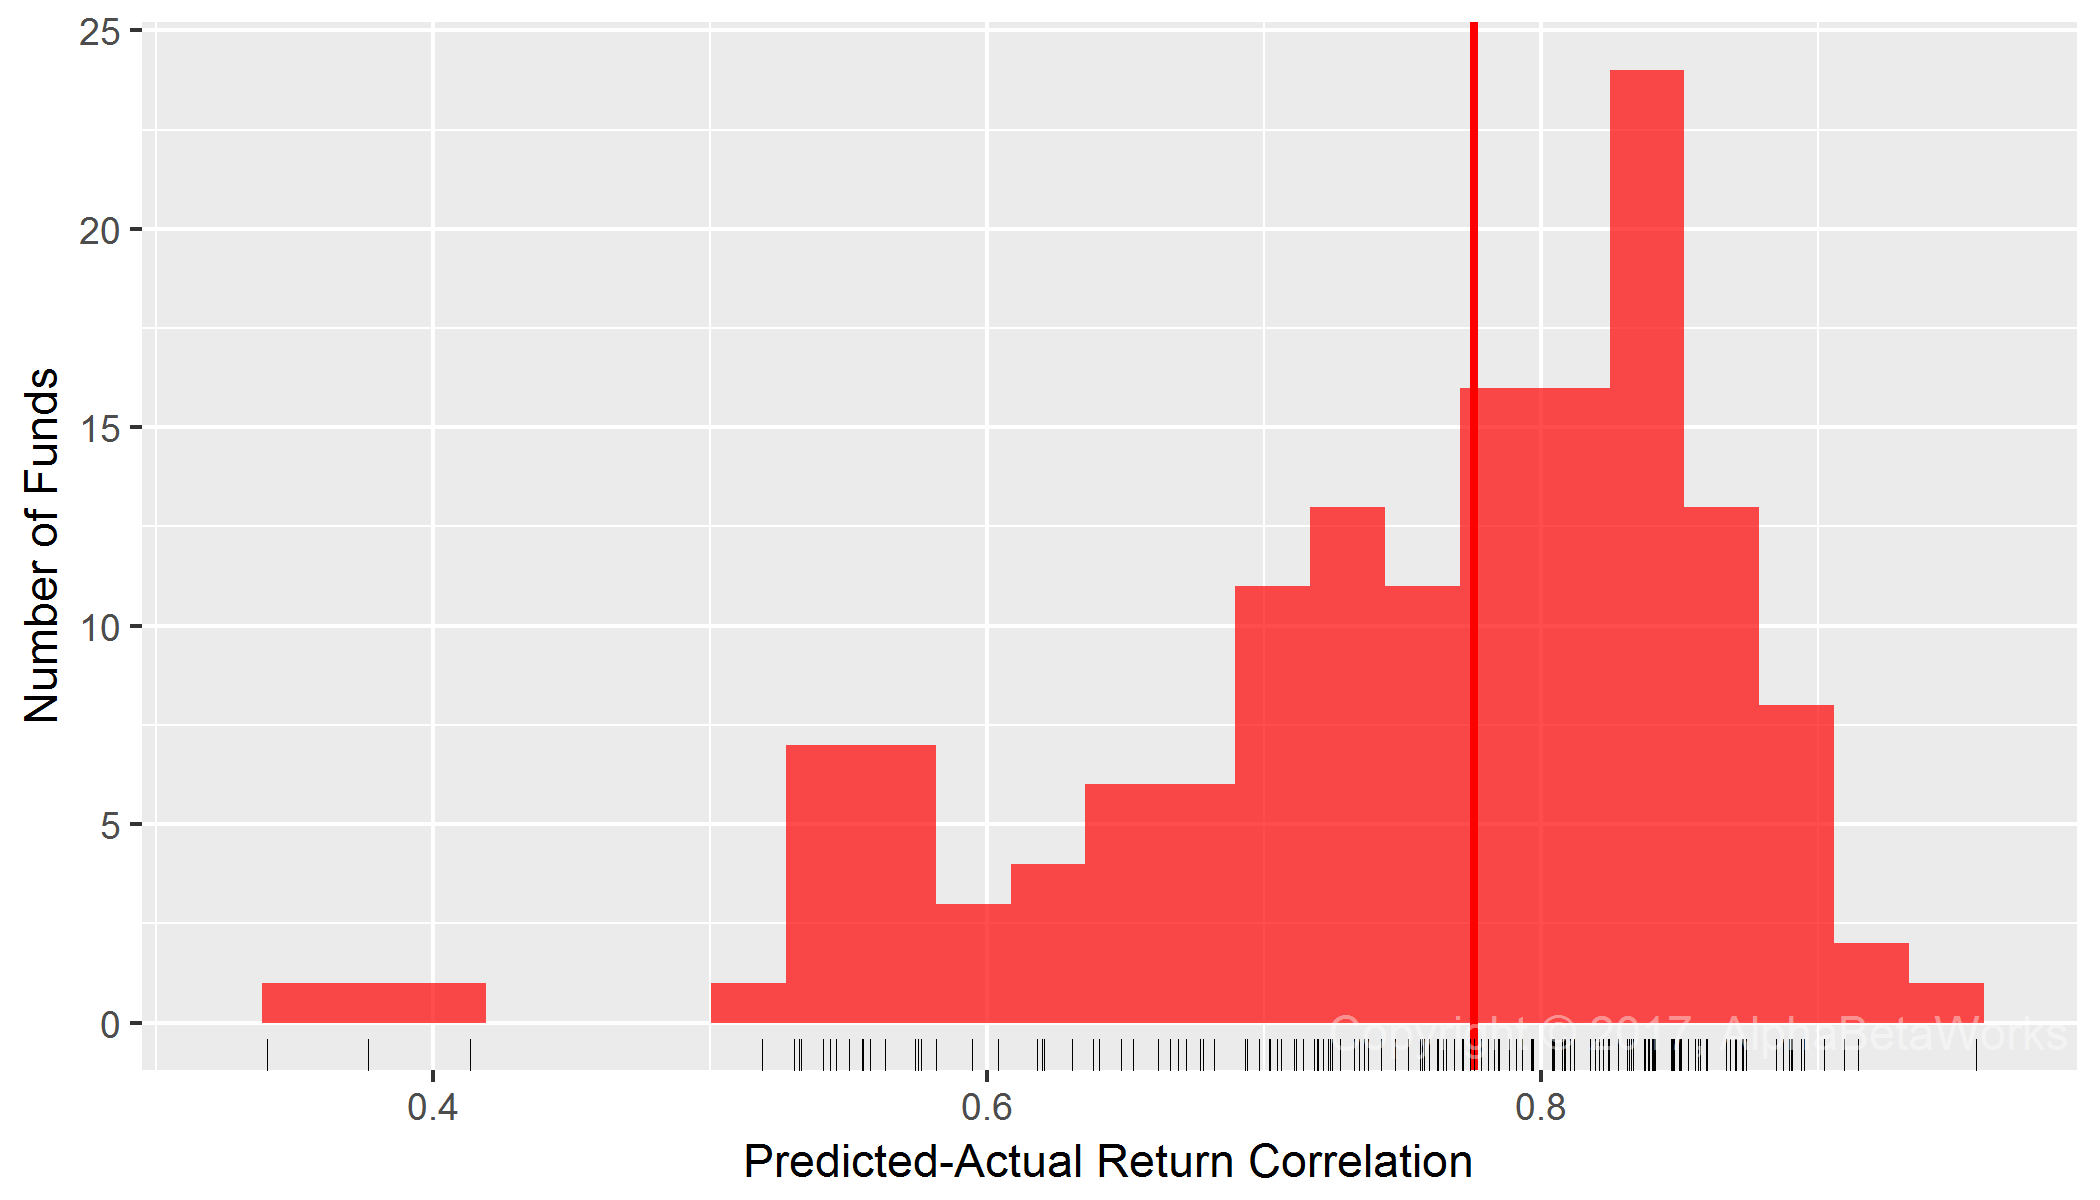
U.S. Smart Beta Equity ETFs: Correlation between predicted relative returns and actual relative returns using dumb beta factors
  Min. 1st Qu.  Median    Mean 3rd Qu.    Max.
0.2094  0.6875  0.7759  0.7447  0.8387  0.9715
Thus, for most broad U.S. equity smart beta ETFs, dumb beta factors account for the majority of tracking error.
Smart Beta Tracking Error and Dumb Beta Tracking Error
Rather than measure correlations between relative returns predicted by dumb beta exposures and actual relative returns, we can instead measure the fraction of relative variance unexplained by dumb beta exposures. This value (in blue below) is the fraction of smart beta tracking error that is unrelated to dumb beta factors:
Percentage of Smart Beta Tracking Error Explained and Unexplained by Dumb Beta Factors
Percentage of Tracking Error Explained by Dumb Beta Factors
 Min. 1st Qu.  Median    Mean 3rd Qu.    Max.
4.384  47.268  60.197  57.141  70.346  94.381
Percentage of Tracking Error Unexplained by Dumb Beta Factors
 Min. 1st Qu.  Median    Mean 3rd Qu.    Max.
5.619  29.654  39.803  42.859  52.732  95.616
Conclusions
- Dumb factor exposures are responsible for over 60% of the smart beta tracking error for most strategies.
- Market and Sector Factors alone account for half of the tracking error for most U.S. equity smart beta ETFs.
- Most smart beta strategies can be viewed as (largely) various approaches to sector rotation. They can also be substantially replicated and blended using sector rotation.


