
Our earlier work showed that performance metrics dominated by market noise, such as simple nominal returns, revert. Because of this reversion, above-average performers of the past tend to become below-average performers and vice versa. Since the reversion is primarily due to systematic (factor) noise, metrics that control for factor exposures reveal persistent stock picking skill. Prompted by readers’ questions, this series of articles will measure the predictive power of popular performance metrics. We first consider the predictive power of Sharpe Ratios. For the universe of all institutional U.S. long equity portfolios, the use of Sharpe Ratios for skill evaluation and manager selection is almost as damaging as the use of simple nominal returns.
Measuring the Predictive Power of Sharpe Ratios
We analyze portfolios of all institutions that have filed Forms 13F in the past 15 years. This survivorship-free portfolio dataset covers firms that have held as least $100 million in long U.S. assets. Approximately 5,000 portfolios had sufficiently long histories, low turnover, and broad holdings to be analyzable.
To measure the decay of performance metrics over time, we compare metrics measured in two 12-month periods separated by variable delay. One example of 24-month delay is metrics for 1/31/2010-1/31/2011 and 1/31/2013-1/31/2014. We use Spearman’s rank correlation coefficient to calculate statistically robust correlations.
Serial Correlation of Sharpe Ratios
Sharpe Ratio is perhaps the most common performance metric. Since it does not directly control for systematic (factor) portfolio exposures, one would expect this approach to suffer from similar reversion as nominal returns. Indeed, tests reveal that Sharpe Ratios fail to isolate security selection performance: Sharpe Ratios of portfolios revert when factor regimes change. Thus, former leaders tend to become laggards, and former laggards tend to become leaders.
The serial correlation (autocorrelation) of Sharpe Ratios is similar to the serial correlation of nominal returns in the next section. The following chart shows correlation between 12-month Sharpe Ratios calculated with lags of one to sixty months (1-60 month lag):
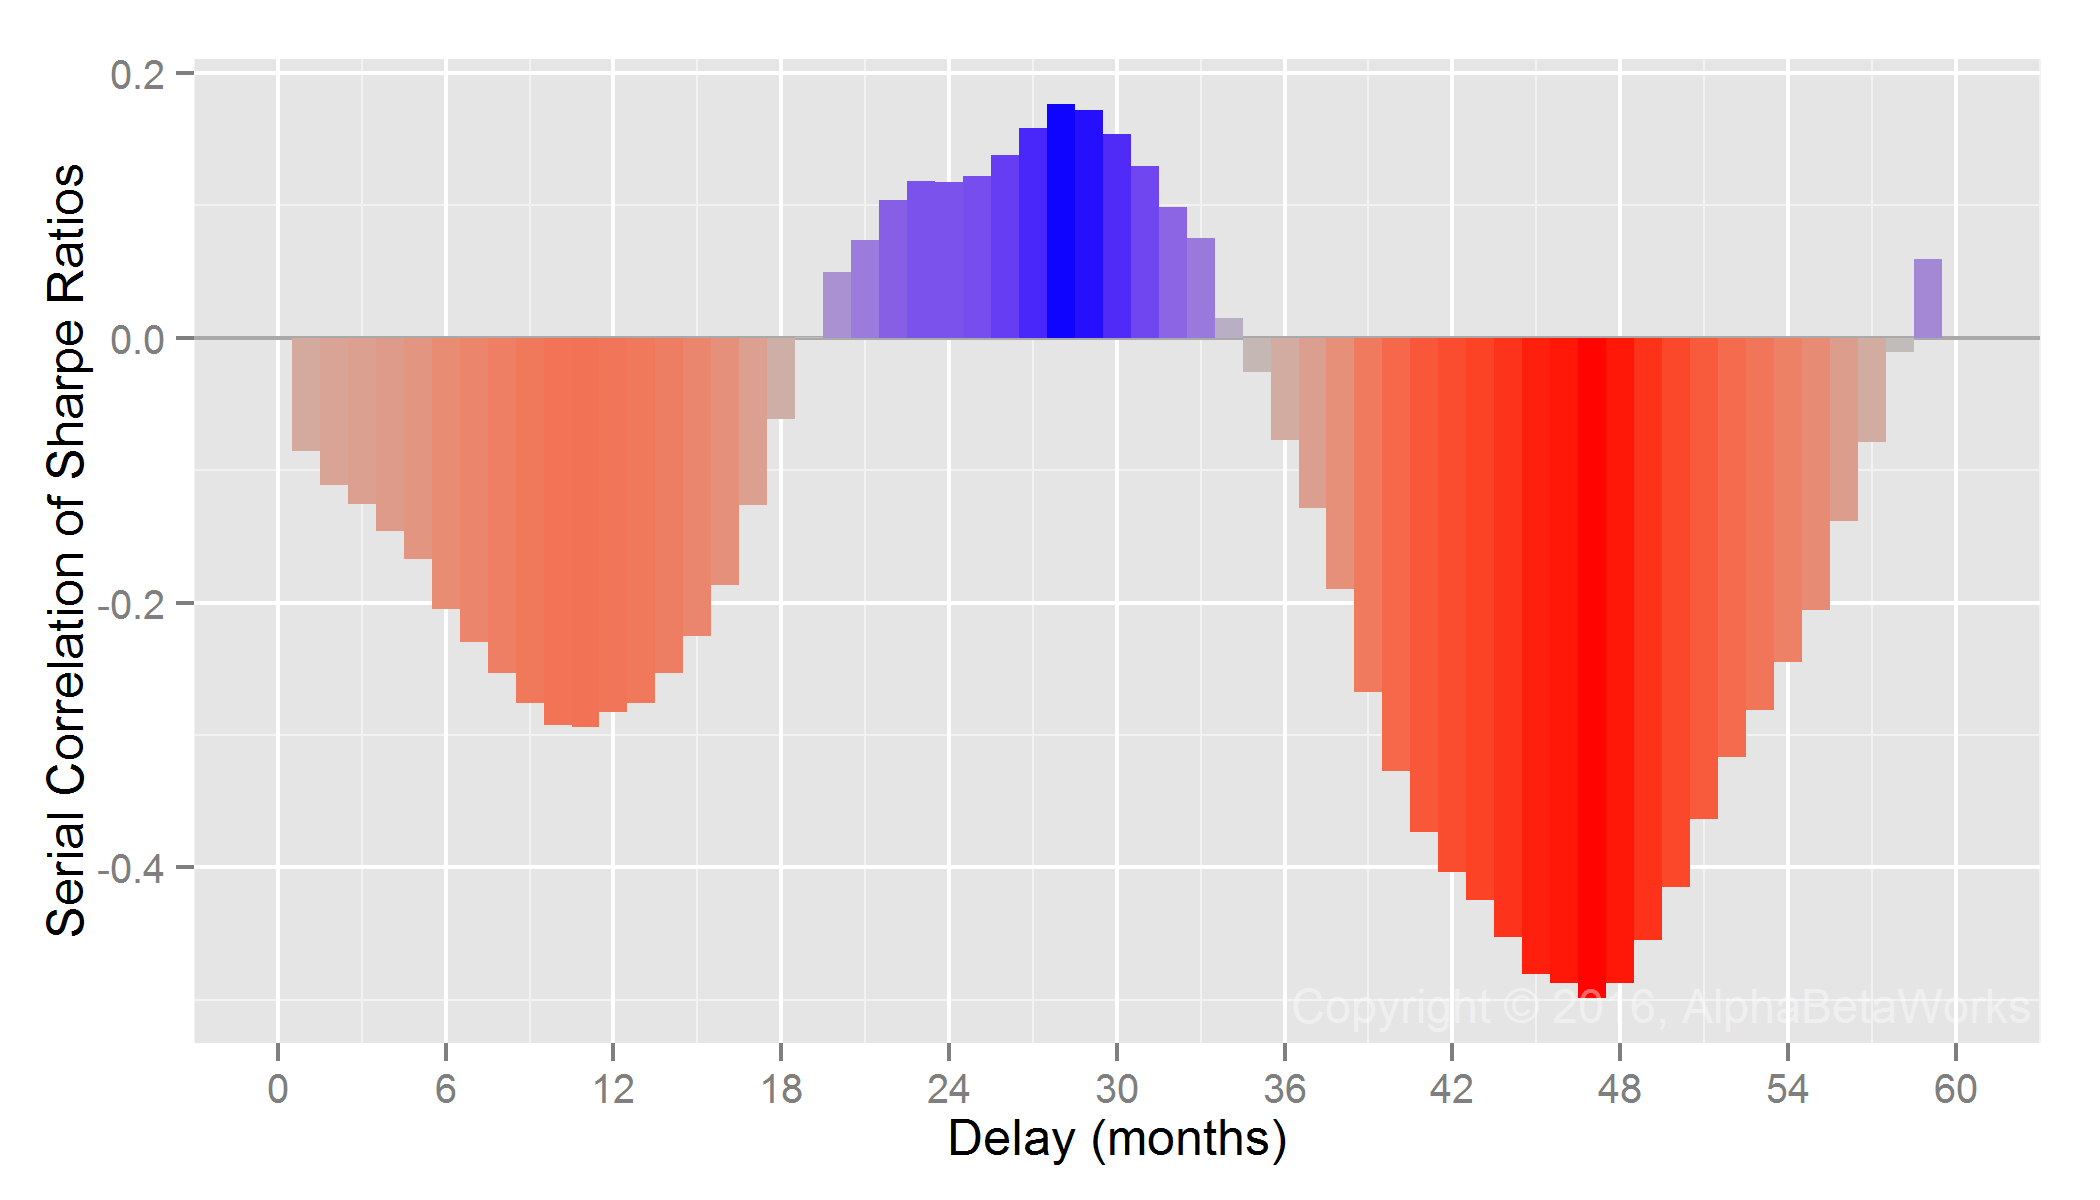
13F Equity Portfolios: Serial correlation of Sharpe Ratios
| Delay (months) | Serial Correlation |
| 1 | -0.09 |
| 6 | -0.20 |
| 12 | -0.28 |
| 18 | -0.06 |
| 24 | 0.12 |
| 30 | 0.15 |
| 36 | -0.08 |
| 42 | -0.40 |
| 48 | -0.49 |
| 54 | -0.24 |
| 60 | 0.12 |
Sharpe Ratios revert with an approximately 18-month cycle. Historical Sharpe Ratios thus have some predictive value, but a negative one. There is a narrow window at 2-3 year lag when past Sharpe Ratios are positively predictive of the future Sharpe Ratios. This is due to the approximately 18-month cycle of reversion.
Serial Correlation of Nominal Returns
For comparison, the following chart shows serial correlations between 12-month cumulative nominal returns calculated with 1-60 month lags. The relationship is similar to that of the Sharpe Ratios. Strong past (nominal) returns are predictive of poor short-term future returns:

13F Equity Portfolios: Serial correlation of nominal returns
| Delay (months) | Serial Correlation |
| 1 | -0.14 |
| 6 | -0.24 |
| 12 | -0.33 |
| 18 | -0.06 |
| 24 | 0.16 |
| 30 | 0.23 |
| 36 | 0.08 |
| 42 | -0.26 |
| 48 | -0.44 |
| 54 | -0.23 |
| 60 | 0.13 |
Serial Correlation of Security Selection Returns
For additional comparison, we provide serial correlation of a security selection metric that adjusts for factor exposures. To eliminate the disruptive factor effects responsible for performance reversion, the AlphaBetaWorks Performance Analytics Platform calculates each portfolio’s return from security selection net of factor effects. αReturn is the return a portfolio would have generated if all factor returns had been flat. Firms with above-average αReturns in one period are likely to maintain them, though with a decay. The following chart shows correlation between 12-month cumulative αReturns calculated with 1-60 month lags:

13F Equity Portfolios: Serial correlation of αReturns (risk-adjusted returns from security selection)
| Delay (months) | Serial Correlation |
| 1 | 0.08 |
| 6 | 0.10 |
| 12 | 0.08 |
| 18 | 0.05 |
| 24 | 0.06 |
| 30 | 0.04 |
| 36 | -0.02 |
| 42 | -0.04 |
| 48 | -0.05 |
| 54 | -0.04 |
| 60 | -0.02 |
Though the above serial correlations of αReturn may appear low, they are amplified and compounded in practical portfolios of multiple funds. A hedged portfolio of the net consensus longs (relative overweights) of the top 5% long U.S. equity stock pickers delivered approximately 8% return independently of the market. The above data is aggregate. Specific outstanding disciplined firms can overcome performance reversion, but they are the exceptions that require careful monitoring.
Summary
- Sharpe Ratios revert rapidly and are not significantly better predictors of future performance than nominal returns.
- Once performance is controlled for systematic (factor) exposures, security selection returns persist for approximately 5 years.
- Selection of superior future performers is possible, but it requires abandoning popular non-predictive metrics and spotting skill long before it is plainly visible and arbitraged away.


