
And why Poor Nominal Returns are a Reason to Hire Rather than Fire a Manager
Our earlier pieces discussed how nominal investment performance reverts. Since returns are dominated by systematic risk factors (primarily the Market), they are subject to reversal when investment regimes change. In the simplest terms, high risk funds do well in bull markets, and low risk funds do well in bear markets, irrespectively of stock picking skill. When the tide turns, so does the funds’ relative performance. The persistence of stock picking skill becomes evident once systematic effects are removed.
This piece focuses on the persistence of negative investment performance. Negative investment performance exacerbates the losses due to simplistic performance metrics and sharpens the edge of predictive skill analytics: Negative nominal returns revert more sharply than overall nominal returns; negative security selection returns persist longer.
Measuring Persistence of Investment Performance
As our prior performance persistence work, this study analyzes portfolios of all institutions that have filed Form 13F during the past 15 years. This survivorship-free portfolio database covers thousands of firms that have held at least $100 million in U.S. long assets during this period.
The relationship between performance metrics of a portfolio calculated at different points in time captures their persistence. To measure the persistence of nominal returns, we analyze nominal returns during two 12-month periods separated by variable delay. For example, analysis of 24-month delay includes periods 1/31/2010-1/31/2011 and 1/31/2013-1/31/2014. We use the Spearman’s rank correlation coefficient to calculate statistically robust correlations between metrics. Technically speaking, we are studying the metrics’ serial correlation or autocorrelation.
The Persistence of Investment Performance
The following charts of autocorrelation have been updated with data through 5/31/2016 and remain virtually unchanged from our earlier work on the decay of stock picking skill.
Serial Correlation of Nominal Returns
Portfolios with above-average nominal returns for prior 12 months tend to underperform for approximately the following two years; similarly, those with below average nominal returns tend to then outperform:

13F Equity Portfolios: Serial correlation of nominal returns
| Delay (months) | Serial Correlation |
| 1 | -0.11 |
| 6 | -0.26 |
| 12 | -0.36 |
| 18 | -0.09 |
| 24 | 0.15 |
| 30 | 0.22 |
| 36 | 0.08 |
| 42 | -0.26 |
| 48 | -0.42 |
| 54 | -0.22 |
| 60 | 0.17 |
Serial Correlation of Security Selection Returns
To eliminate the disruptive factor effects responsible for the above reversion, the AlphaBetaWorks Performance Analytics Platform calculates return from security selection after controlling for the factor exposures. The resulting metric, αReturn, is the return a portfolio would have generated if all factor returns had been flat. Above-average and below-average 12-month αReturns tend to persist for approximately four years:

| Delay (months) | Serial Correlation |
| 1 | 0.08 |
| 6 | 0.10 |
| 12 | 0.08 |
| 18 | 0.05 |
| 24 | 0.05 |
| 30 | 0.04 |
| 36 | -0.01 |
| 42 | -0.03 |
| 48 | -0.04 |
| 54 | -0.03 |
| 60 | -0.01 |
The Persistence of Negative Investment Performance
The autocorrelation of overall nominal returns and αReturns captures the persistence of both negative and positive investment performance, but positive and negative metrics need not have similar persistence. In fact, the problems with nominal returns and simplistic performance metrics derived from them are accentuated when the nominal returns are negative.
Serial Correlation of Negative Nominal Returns
Negative 12-month nominal returns revert even more rapidly and more strongly than overall returns. Rank correlation coefficient for 12-month nominal returns separated by 6 months is approximately -0.5 for negative nominal returns and -0.2 for overall nominal returns. Poor recent nominal returns are a reason to hire rather than fire a manager, at least in the short term (the subsequent 12-18 months):
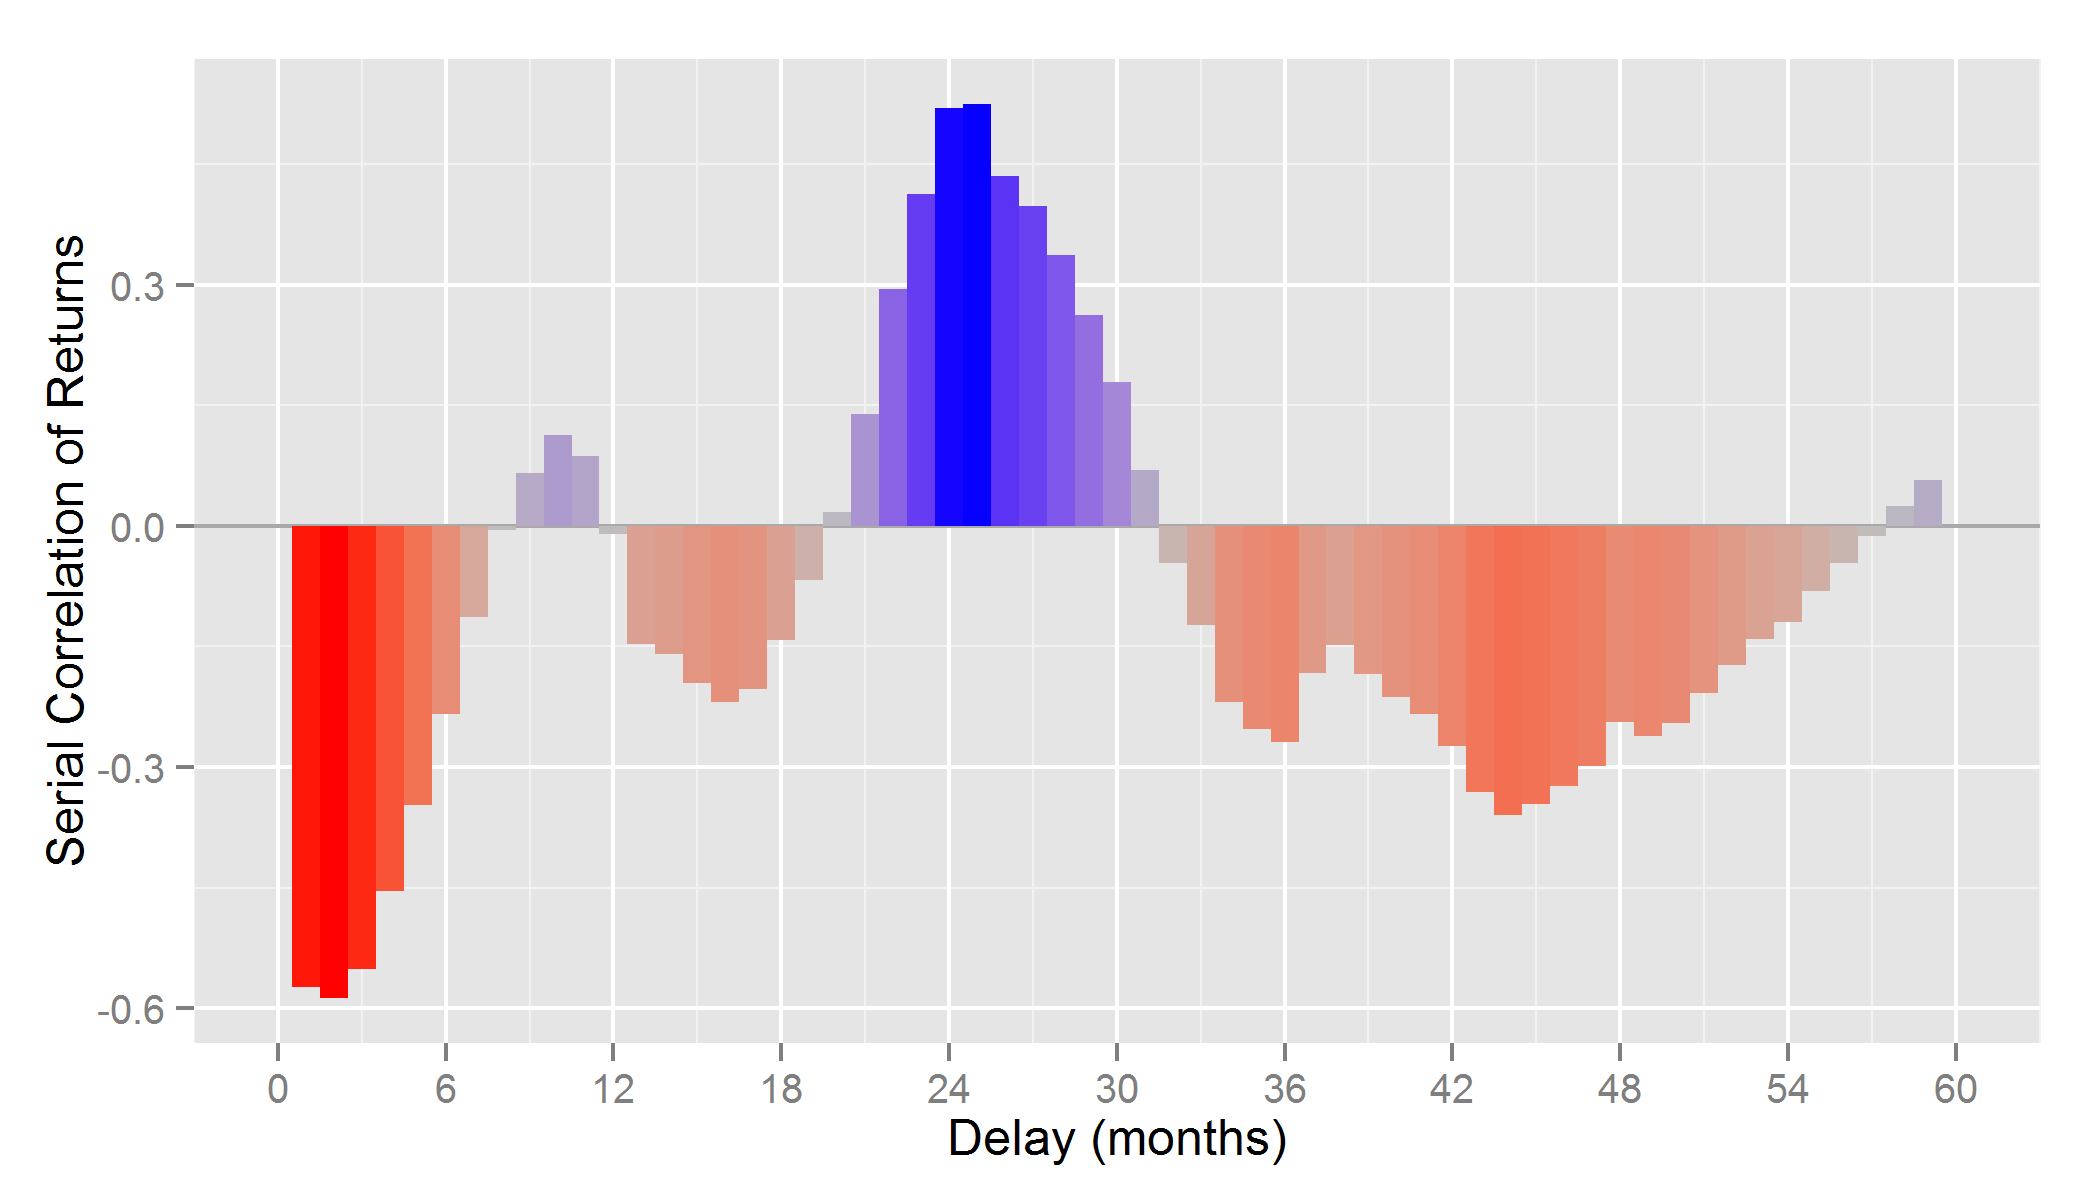
13F Equity Portfolios: Serial correlation of negative nominal returns
| Delay (months) | Serial Correlation |
| 1 | -0.57 |
| 6 | -0.23 |
| 12 | -0.01 |
| 18 | -0.14 |
| 24 | 0.52 |
| 30 | 0.18 |
| 36 | -0.27 |
| 42 | -0.27 |
| 48 | -0.24 |
| 54 | -0.12 |
| 60 | 0.07 |
Serial Correlation of Negative Security Selection Returns
This reversion is not present for αReturns. Negative αReturns have similar autocorrelation for the first few years and decay more slowly than overall αReturns:
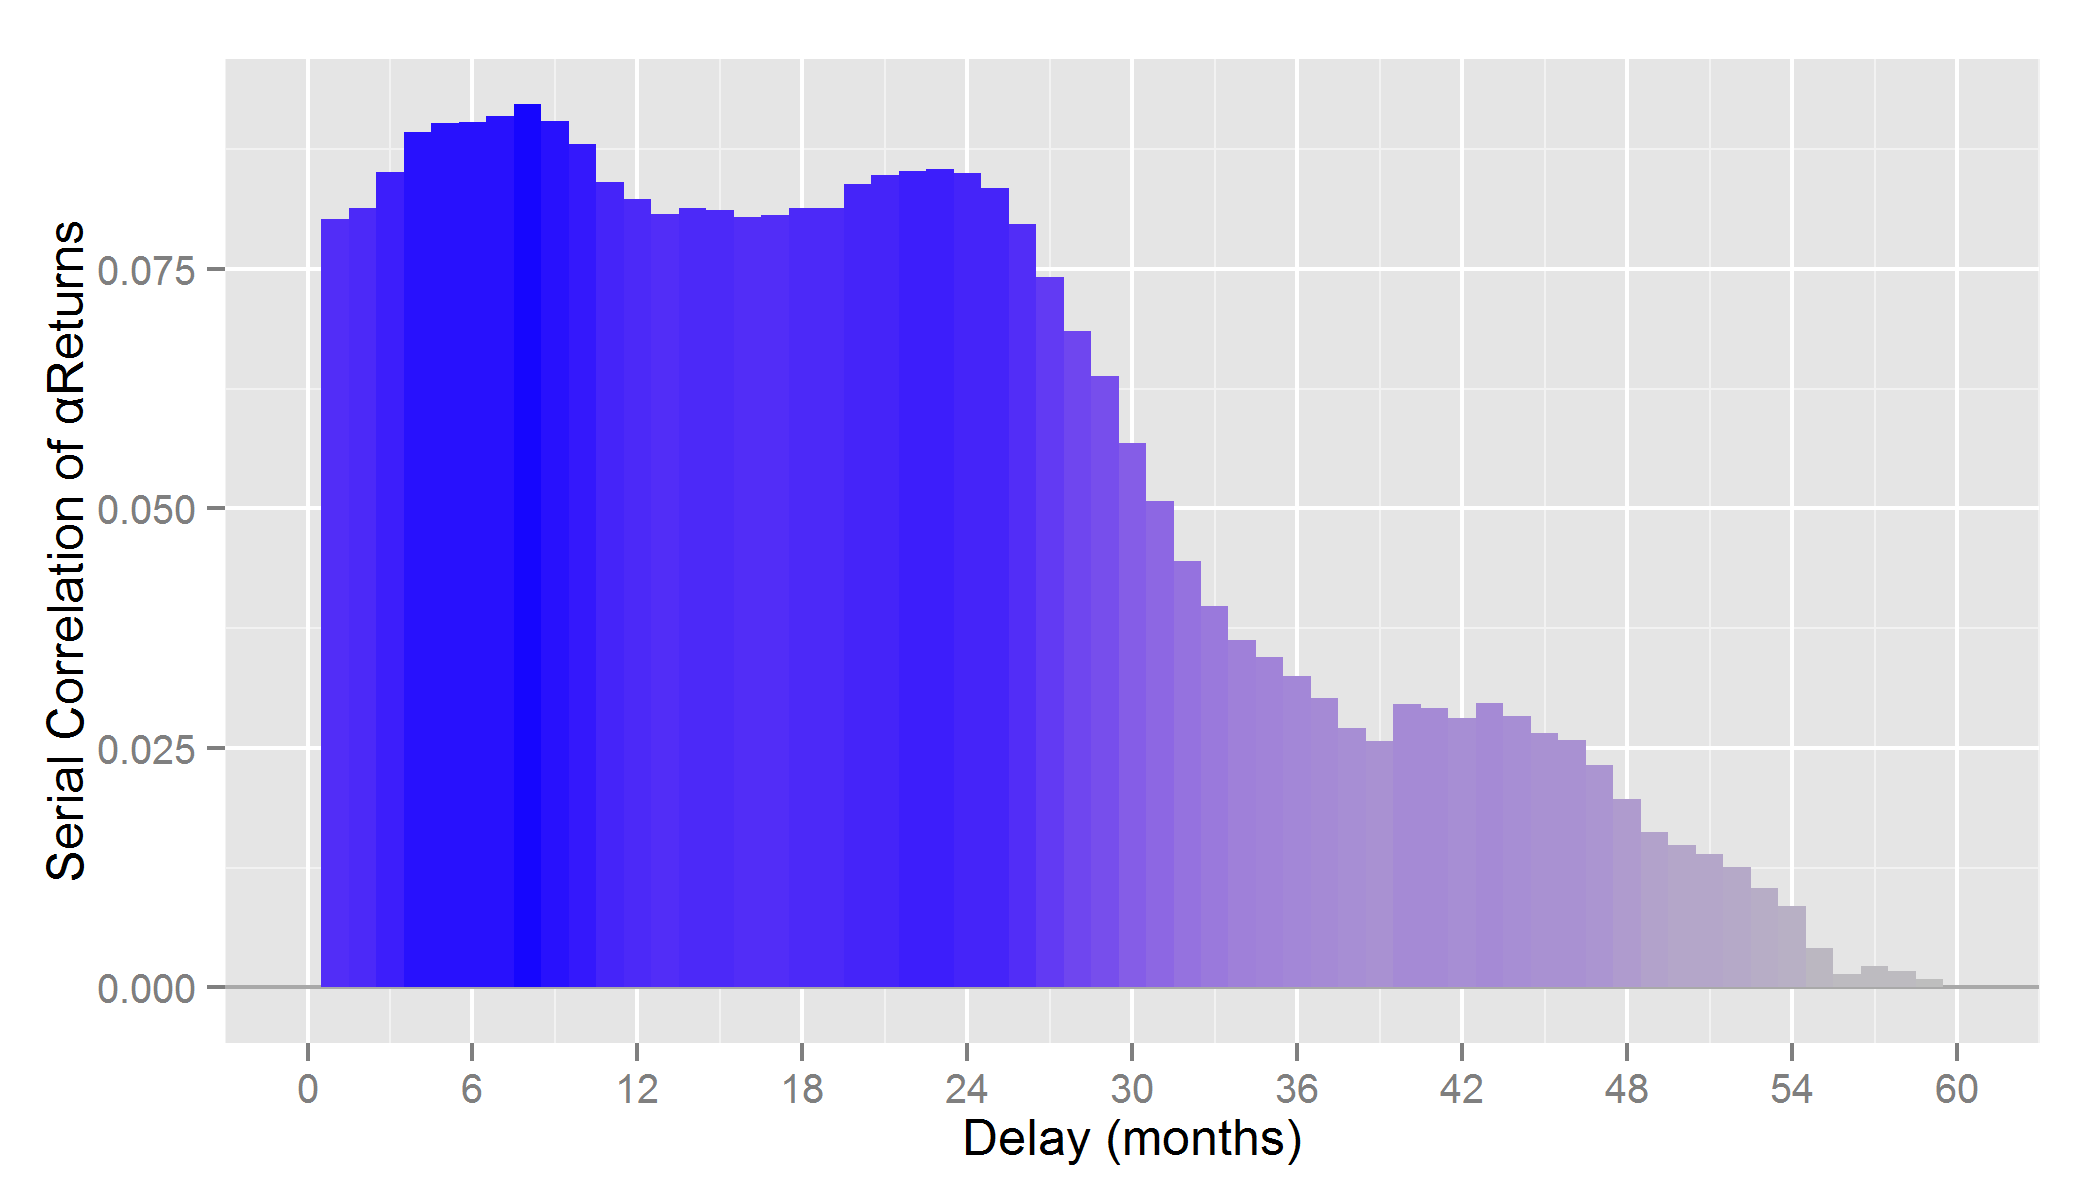
13F Equity Portfolios: Serial correlation of αReturns (risk-adjusted returns from security selection)
| Delay (months) | Serial Correlation |
| 1 | 0.08 |
| 6 | 0.09 |
| 12 | 0.08 |
| 18 | 0.08 |
| 24 | 0.08 |
| 30 | 0.06 |
| 36 | 0.03 |
| 42 | 0.03 |
| 48 | 0.02 |
| 54 | 0.01 |
| 60 | 0.00 |
The decay in security selection performance is typically due to such things as talent turnover, style drift, management distraction, and asset growth. Since these are more likely to affect the top-performing funds, negative αReturn remains predictive for longer. The above data is aggregate and specific firms can and do overcome the average fate. Though the above serial correlations may appear low, they are amplified and compounded in portfolios of multiple funds.
Cheerful consensus is usually a recipe for mediocrity, whether investing in a stock or in a fund. Fear and panic in the face of nominal underperformance are more dangerous still. Just as it pays to be a contrarian stock picker, it pays to be a contrarian fund investor or allocator.
Summary
- Nominal returns and related simplistic metrics of investment skill revert rapidly.
- Negative nominal returns revert more strongly than overall nominal returns.
- Negative security selection performance persists longer than overall security selection performance.
- When negative investment performance is merely nominal, it is a contrarian indicator.
- When negative investment performance is due to poor security selection net of factor effects, it is a persistent and predictive indicator.


