EHTH (eHealth, Inc.), an Internet health insurance agency, was down over 50% following disappointing revenue and EPS guidance. The events were yet another example of the mass sell-offs in crowded hedge fund bets after disappointing news. This once again demonstrates that investors must monitor their portfolios for crowding.
EHTH was not the largest stock-specific hedge fund insurance sector bet, but it was one of the least liquid. The aggregate crowded position constituted about nine days’ trading volume. As funds struggled to exit, more shares traded in one day than in the prior week, knocking the price down 54%. We illustrate how investors aware of this crowding could have avoided the losses.
To explore crowding we analyze hedge fund Life and Health Insurance Sector holdings (HF Sector Aggregate) relative to the Sector Market Portfolio (Sector Aggregate). HF Sector Aggregate is position-weighted while Sector Aggregate is capitalization-weighted. This follows the approach of our earlier articles on aggregate and sector-specific hedge fund crowding. Crowded positions are vulnerable to volatility, mass liquidation, and losses; they persistently underperform in some sectors.
Hedge Fund Life and Health Insurance Performance
The figure below plots historical return of HF Life and Health Insurance Aggregate. Factor return is due to systematic (market) risk. Blue area represents positive and gray area represents negative risk-adjusted returns from security selection (αReturn). Crowded bets underperformed the factor portfolio by over 35%:
Hedge Fund Life and Health Insurance Risk-Adjusted Performance
The risk-adjusted return from security selection (αReturn) of HF Sector Aggregate is the return it would have generated if markets were flat – all market effects on performance have been eliminated. This is the idiosyncratic performance of the crowded portfolio. Crowded bets in this sector are especially dangerous, given their propensity to disappoint:
Crowded Hedge Fund Life and Health Insurance Ideas
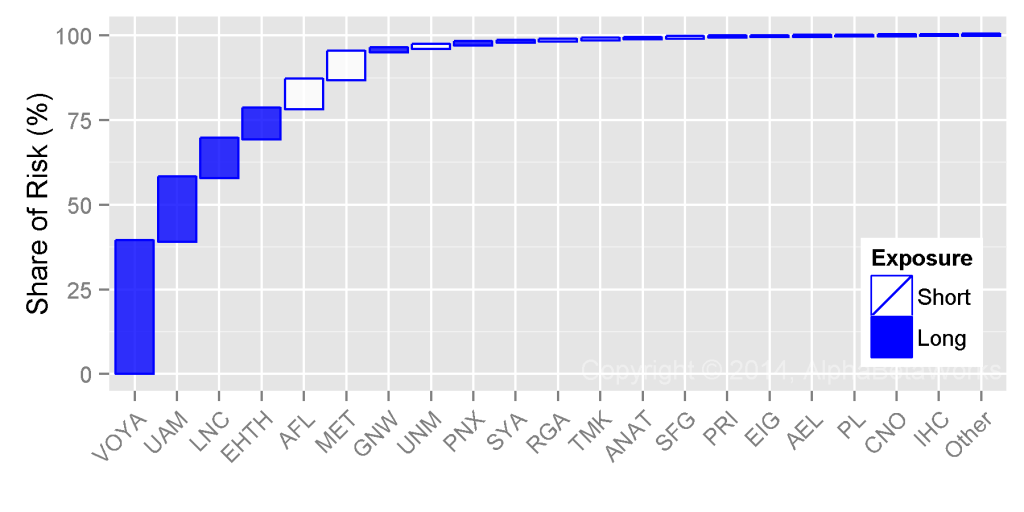
The following stocks contributed most to the relative residual (security-specific) risk of the HF Sector Aggregate as of Q3 2014. Blue bars represent long (overweight) exposures relative to Sector Aggregate. White bars represent short (underweight) exposures. Bar height represents contribution to relative stock-specific risk:
The following table contains detailed data on these crowded ideas:
| Exposure (%) | Net Exposure | Share of Risk (%) | |||||
| HF Sector Aggr. | Sector Aggr. | % | $mil | Days of Trading | |||
| VOYA | Voya Financial, Inc. | 29.79 | 5.83 | 23.96 | 375.4 | 4.5 | 39.08 |
| UAM | Universal American Corp. | 8.73 | 0.39 | 8.34 | 130.7 | 123.5 | 18.76 |
| LNC | Lincoln National Corporation | 23.20 | 8.45 | 14.75 | 231.2 | 1.9 | 11.48 |
| EHTH | eHealth, Inc. | 3.55 | 0.26 | 3.29 | 51.6 | 8.9 | 8.98 |
| AFL | Aflac Incorporated | 1.05 | 15.94 | -14.88 | -233.2 | -1.6 | 8.52 |
| MET | MetLife, Inc. | 12.56 | 36.31 | -23.75 | -372.1 | -1.1 | 8.15 |
| GNW | Genworth Financial, Inc. Class A | 5.55 | 3.93 | 1.62 | 25.4 | 0.3 | 1.04 |
| UNM | Unum Group | 0.92 | 5.29 | -4.37 | -68.5 | -1.0 | 0.97 |
| PNX | Phoenix Companies, Inc. | 1.59 | 0.19 | 1.39 | 21.9 | 9.5 | 0.87 |
| SYA | Symetra Financial Corporation | 3.75 | 1.63 | 2.12 | 33.1 | 3.6 | 0.42 |
| RGA | Reinsurance Group of America, Incorporat | 0.55 | 3.32 | -2.76 | -43.3 | -1.4 | 0.28 |
| TMK | Torchmark Corporation | 0.00 | 4.13 | -4.13 | -64.7 | -1.5 | 0.27 |
| ANAT | American National Insurance Company | 0.00 | 1.82 | -1.82 | -28.6 | -17.4 | 0.27 |
| SFG | StanCorp Financial Group, Inc. | 0.00 | 1.64 | -1.64 | -25.6 | -1.8 | 0.24 |
| PRI | Primerica, Inc. | 0.00 | 1.58 | -1.58 | -24.8 | -1.7 | 0.16 |
| EIG | Employers Holdings, Inc. | 1.06 | 0.37 | 0.69 | 10.8 | 4.1 | 0.10 |
| AEL | American Equity Investment Life Holding | 0.13 | 1.03 | -0.91 | -14.2 | -0.7 | 0.09 |
| PL | Protective Life Corporation | 2.41 | 3.32 | -0.91 | -14.2 | -0.3 | 0.08 |
| CNO | CNO Financial Group, Inc. | 3.11 | 2.13 | 0.98 | 15.4 | 0.6 | 0.07 |
| IHC | Independence Holding Company | 0.60 | 0.14 | 0.46 | 7.2 | 42.1 | 0.05 |
| … | Other Positions | 0.03 | 0.11 | ||||
| Total | 100.00 | ||||||
The table above shows that, while EHTH was neither the highest contributor to risk nor the most illiquid, it was one of the top bets in each category. When the bad news came, its value halved. VOYA, UAM, and LNC, the other large and illiquid bets, are also at risk. Even when a positive catalyst arrives, impatient hedge fund holders may sell on the news, muting any upside. Whether or not investors choose to steer clear of crowded names, they must monitor them. With proper data, this attention to crowding can prevent “unexpected” volatility.
Conclusion
eHealth illustrates the vulnerability of crowded and illiquid positions to disorderly liquidation. eHealth was especially dangerous, given the tendency of crowded hedge fund life and health insurance ideas to disappoint. Investors armed with hedge fund crowding insights could have avoided these losses.


