Returns-Based Analysis and Fund Beta
In an earlier article, we discussed the failures of returns-based style analysis – a common method of estimating fund risk:
- Returns-based analysis is usually flawed when portfolio risk varies over time.
- Returns-based analysis may not even accurately estimate average or representative risk of the portfolio.
- Flaws are most pronounced for the most active funds – precisely the ones most in need of accurate analysis.
These flaws can be addressed by analyzing historical portfolio holdings, estimating their factor exposures, and aggregating these estimates. This approach requires a robust risk model and is favored by AlphaBetaWorks.
Parnassus Core Equity Fund (PRILX) Returns-Based Beta
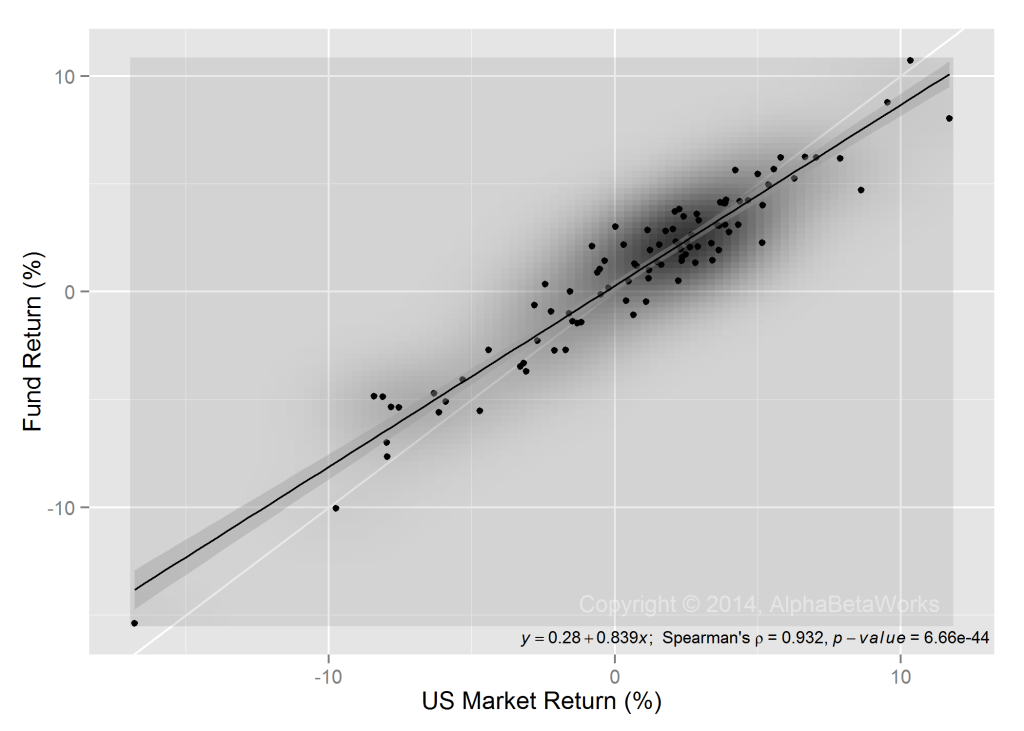
Returns-based analysis estimates market exposure (beta) using one or more linear regressions, possibly with several independent variables. We use one fund, the Parnassus Core Equity Fund (PRILX) as an example. For PRILX, a simple single-factor linear regression estimates beta near 0.84:
This type of regression is the foundation of returns-based style analysis.
Parnassus Core Equity Fund (PRILX) Beta History
A key assumption of returns-based analysis is that beta does not vary over the regression period.
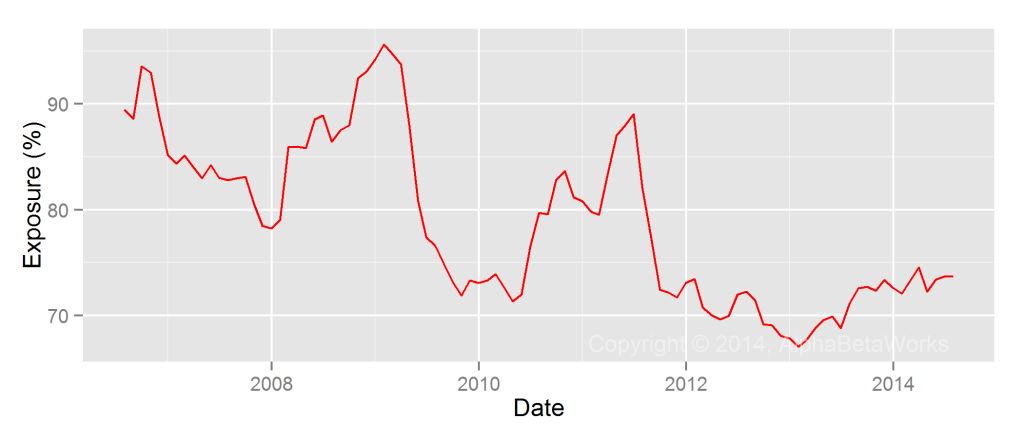
To test this U.S. Market beta estimate, we used the AlphaBetaWorks Statistical Equity Risk Model to estimate monthly U.S. Market exposures of PRILX. The model estimated the exposures of individual holdings. It then combined these into aggregate portfolio beta. Over the past 10 years, the fund has varied U.S. Market exposure between 68% and 95% (0.68 to 0.95 beta):
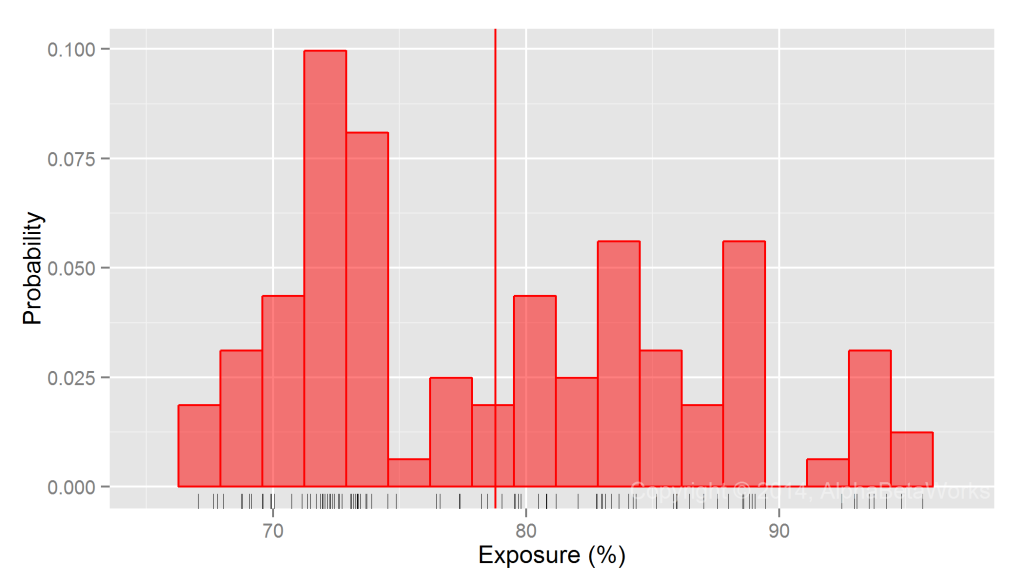
PRILX’s average U.S. Market exposure was approximately 79% (0.79 beta) during the period. However, actual beta was rarely near the average:
Implications of Beta Estimation Errors
For low-volatility funds whose risk profiles vary little over time, the shortcomings of returns-based attribution are relatively minor. For higher volatility strategies, they are severe.
The 5% difference in estimate exposure (0.05 difference in estimated beta) above is not trivial: U.S. Market is up approximately 140% over the past 10 years. A 0.05 difference in estimated average beta translates into a 7% difference in returns attributable to beta over this period.
In addition, returns-based analysis obscured the variation in beta over history: Since 2012 beta has been below 0.75. Consequently, returns-bases analysis’ attribution of performance to market and non-market sources is further off the mark.


