Several of our articles discussed the vulnerability of crowded hedge fund positions to volatility, mass liquidation, and losses. We illustrated specific blow-ups (SanDisk (SNDK) and eHealth (EHTH)), as well as sectors with persistently poor hedge fund performance (Oil and Gas Production and Miscellaneous Mining). However, we have not showed how representative these examples are. This piece illustrates the performance toll of hedge fund crowding in a single (especially damaging) month – January 2015.
Identifying Crowding
We analyze hedge fund holdings (HF Aggregate) relative to the market portfolio (Market Aggregate). HF Aggregate is position-weighted while Market Aggregate is capitalization-weighted. We follow the approach of our earlier articles on aggregate and sector-specific hedge fund crowding.
January 2015 Hedge Fund Crowding Toll
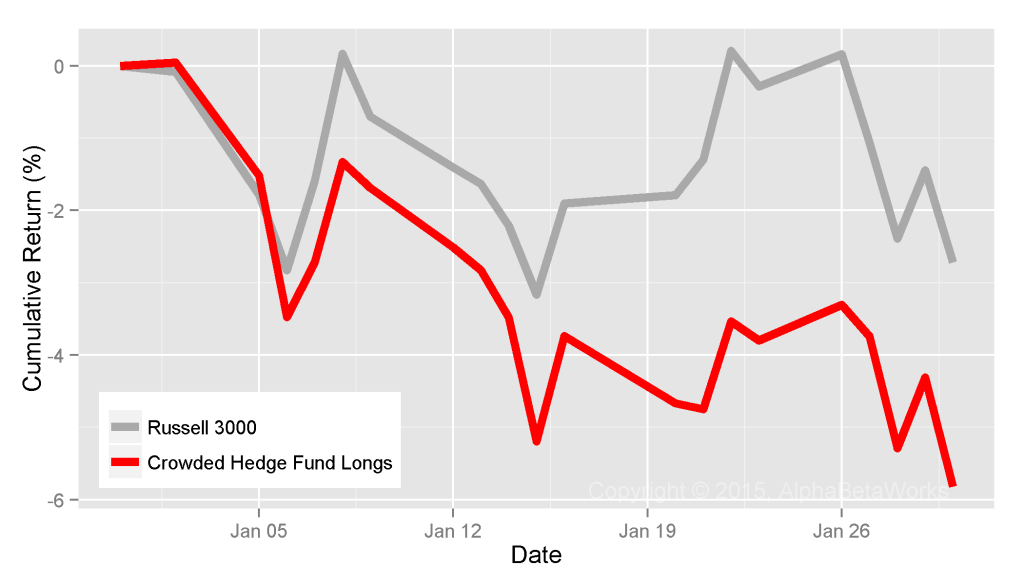
January 2015 is a convenient month to consider: Due to intra-month volatility, the market was approximately flat at several dates. Hence, relative performance at these points gives a good picture of risk-adjusted performance. Whereas Russell 3000 was down about 2.7%, the portfolio of equal-weighted crowded hedge fund longs (in red on the chart below) declined twice as much:
The crowded hedge fund longs in the above chart consist of HF Aggregate’s illiquid long bets relative to the Market Aggregate. Illiquid longs are overweight exposures of HF Aggregate valued at over 10 days of trading volume. We have discussed earlier that illiquidity is a key source of crowding risk since funds have difficulty exiting these positions. The specific 10 day limit was chosen arbitrarily. Below we show that results are consistent across a broad range of liquidity limits. The portfolio was constructed using AlphaBetaWorks’ Q3 2014 hedge fund crowding dataset, available to subscribers in late November.
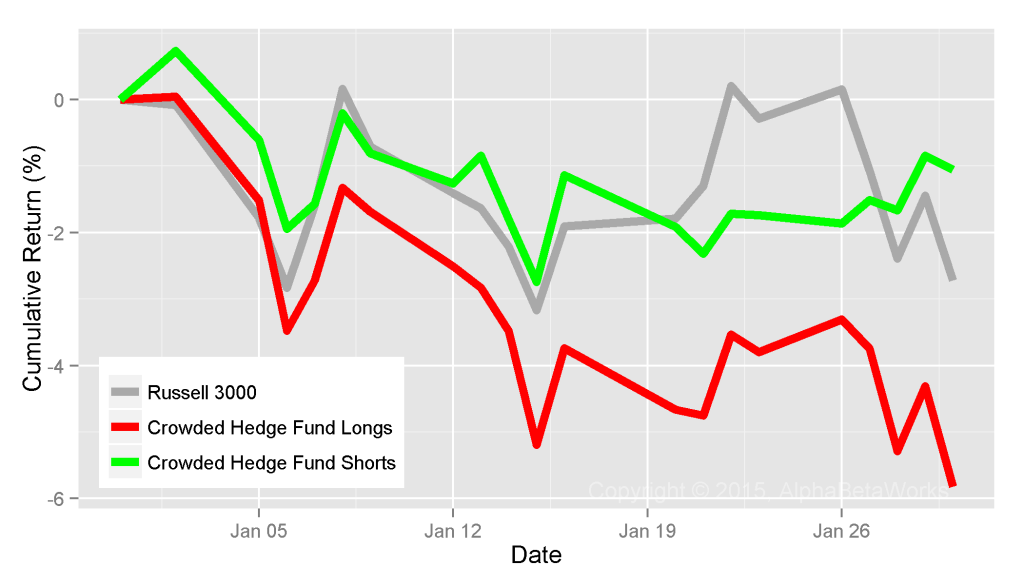
Crowded hedge fund shorts are defined similarly: They consist of illiquid underweights relative to the Market Aggregate valued at over 10 days of trading volume. Crowded shorts (in green on the chart below) slightly outperformed the market in January:
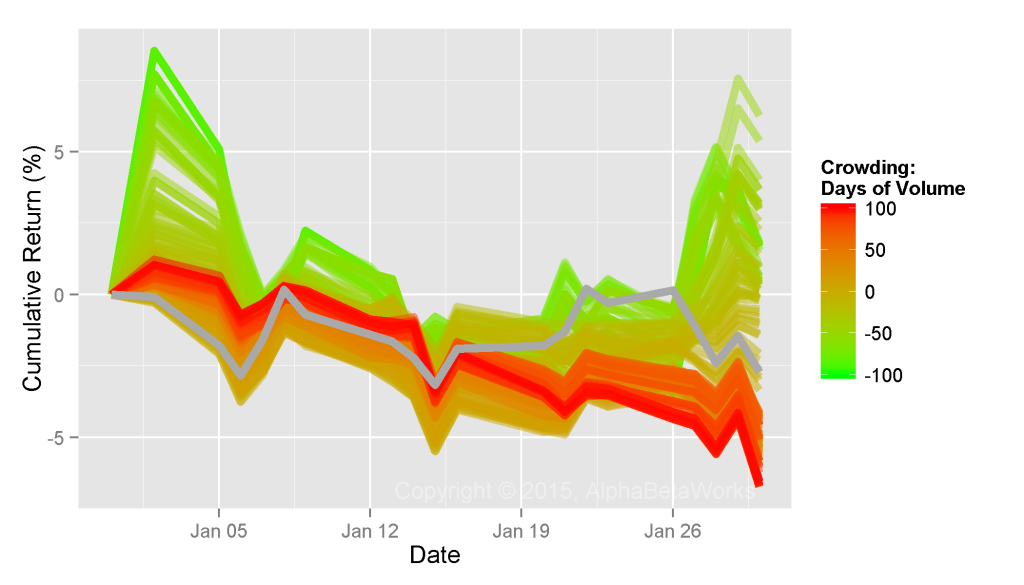
The performance of crowded hedge fund bets was roughly proportional to their crowding and liquidity. In the following chart, each line represents the performance of crowded hedge fund bets with a given level of crowding. Crowded and illiquid longs sized at 100 days of volume (red), underperformed crowded longs sized at 50 days (orange), etc. Meanwhile, illiquid shors (in shades of green) outperformed dramatically:
In general, the larger and more illiquid a crowded hedge fund long bet was, the worse it fared. Even when a positive catalyst ought to lift a crowded long, impatient hedge fund holders may sell on the news, muting any upside. On the other hand, even when a negative catalyst ought to sink a crowded short, managers may buy on the news, muting any downside.
The damage covered a variety of industries and company sizes. Some of the notable losses in the crowded and illiquid long group were the following:
|
HF Aggregate Exposure |
||||
| Symbol | Name | Value ($ mil) | Liquidity (days) | Performance (%) |
| NOR | Noranda Aluminum Holding Corporation | 103.80 | 40.19 | -16.68 |
| NMIH | NMI Holdings, Inc. Class A | 127.93 | 43.41 | -16.71 |
| AGYS | Agilysys, Inc. | 100.22 | 114.63 | -18.42 |
| RP | RealPage, Inc. | 112.04 | 10.96 | -18.73 |
| LPG | Dorian LPG Ltd. | 107.44 | 28.71 | -19.01 |
| TWI | Titan International, Inc. | 125.13 | 16.29 | -19.09 |
| HTZ | Hertz Global Holdings, Inc. | 2778.20 | 10.77 | -20.46 |
| DPM | DCP Midstream Partners, LP | 377.28 | 15.00 | -20.85 |
| HLF | Herbalife Ltd. | 982.00 | 10.42 | -22.16 |
| THRX | Theravance, Inc. | 321.32 | 19.18 | -24.92 |
| SALT | Scorpio Bulkers, Inc. | 139.66 | 32.25 | -25.35 |
| SXC | SunCoke Energy, Inc. | 161.15 | 16.09 | -25.73 |
| CACQ | Caesars Acquisition Co. Class A | 110.62 | 83.10 | -29.25 |
| SD | SandRidge Energy, Inc. | 317.85 | 11.38 | -29.83 |
| YRCW | YRC Worldwide Inc. | 280.23 | 15.99 | -36.12 |
| CZR | Caesars Entertainment Corporation | 245.84 | 10.74 | -39.47 |
| LE | Lands’ End, Inc. | 321.92 | 12.10 | -46.47 |
| ASPS | Altisource Portfolio Solutions S.A. | 245.55 | 10.77 | -52.17 |
| ADES | Advanced Emissions Solutions, Inc. | 107.92 | 41.21 | -77.55 |
| OCN | Ocwen Financial Corporation | 910.00 | 12.37 | -87.76 |
Some of the notable gains in the crowded short group were the following:
|
HF Aggregate Exposure |
||||
| Symbol | Name | Value ($ mil) | Liquidity (days) | Performance (%) |
| SBUX | Starbucks Corporation | -766.74 | -2.02 | 6.78 |
| KR | Kroger Co. | -390.36 | -1.81 | 6.80 |
| SPG | Simon Property Group, Inc. | -508.85 | -1.90 | 6.83 |
| LUV | Southwest Airlines Co. | -767.17 | -1.88 | 6.89 |
| NS | NuStar Energy L.P. | -141.06 | -3.79 | 6.97 |
| PRXL | PAREXEL International Corporation | -277.74 | -6.47 | 7.09 |
| BAH | Booz Allen Hamilton Holding Corporation Class A | -140.18 | -7.13 | 7.60 |
| ICLR | ICON Plc | -281.30 | -9.46 | 8.28 |
| GILD | Gilead Sciences, Inc. | -2122.35 | -1.29 | 9.56 |
| BA | Boeing Company | -2372.83 | -4.29 | 9.78 |
| NEU | NewMarket Corporation | -178.11 | -10.24 | 10.35 |
| PBYI | Puma Biotechnology, Inc. | -109.17 | -1.57 | 10.75 |
| ATK | Alliant Techsystems Inc. | -108.27 | -2.90 | 11.02 |
| TMUS | T-Mobile US, Inc. | -149.48 | -1.11 | 11.13 |
| BIIB | Biogen Idec Inc. | -1221.11 | -2.01 | 12.86 |
| SLXP | Salix Pharmaceuticals, Ltd. | -695.73 | -2.19 | 14.75 |
| PCRX | Pacira Pharmaceuticals, Inc. | -249.52 | -4.43 | 16.82 |
| CLR | Continental Resources, Inc. | -535.76 | -3.54 | 17.56 |
| HAR | Harman International Industries, Incorporated | -111.76 | -1.31 | 19.27 |
| ICPT | Intercept Pharmaceuticals, Inc. | -378.15 | -4.27 | 25.29 |
January 2015 was an especially costly month for crowded hedge fund ideas, but it illustrated a broad and consistent effect. Crowding takes a heavy toll on performance and warrants close scrutiny from portfolio managers, analysts, and allocators.


