Separating the Signal from the Noise in the Energy Sector
In an article introducing pure sector factors, we illustrated how market noise obscures relationships among individual sectors, concealing industry-specific performance. As a result, most investors are oblivious of the underlying secular trends and are frequently blindsided by them. This obliviousness can be costly. For example, investors aware of the pure oil and gas producer performance would have been forewarned of the recent energy sector selloff.
Oil and Gas Producer Sector Performance
The selloff in oil and gas producer equities in September and October of 2014 caught some by surprise. It should not have.
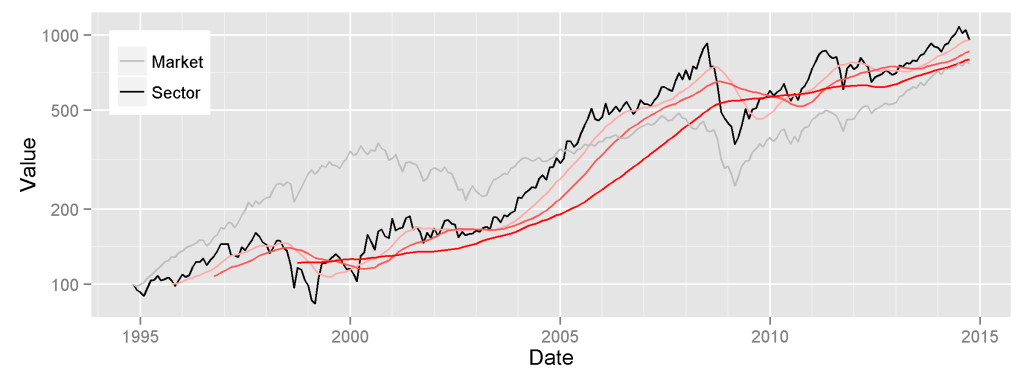
A superficial analysis of oil and gas producers’ performance would simply consider historical returns. The sector roughly tracked the broad market, increasing over 200% since 2009 lows:
This simple chart conceals powerful secular trends. Obscured by market noise, the underlying energy sector cycle is concealed.
Oil and Gas Producer Pure Sector Factor
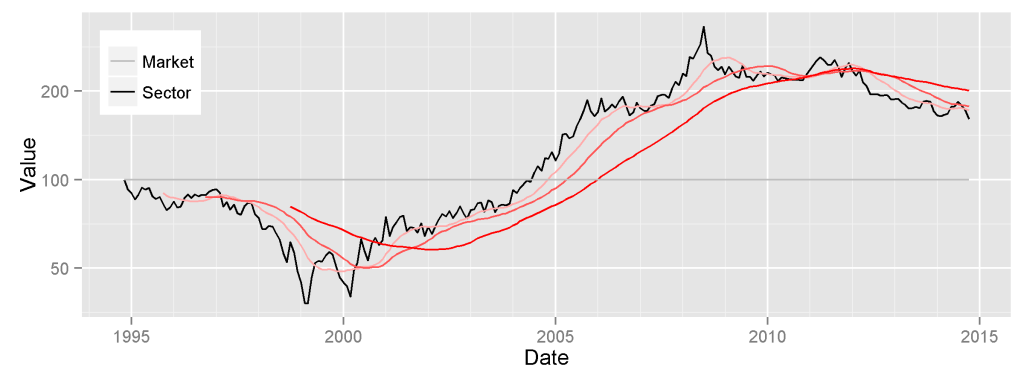
We reveal the underlying trends by removing market and macroeconomic effects from security returns and calculating the performance of pure oil and gas producer sector factor. Contrary to the chart above, the sector’s pure performance since 2009 lows was -20%:
The pure sector factor tracks the energy cycle, revealing a story of broad economic and geopolitical trends:
- Overcapacity and crash of the late-90s;
- Supply shortages, emerging-market commodity boom, and unconventional revolution of 2000-2008;
- Low-cost production growth, over-investment, and a return to overcapacity post-2008.
Since the energy cycle peaked in 2008, the oil and gas producer sector has lagged the market, on a risk-adjusted basis, by over 35%. Investors in the sector have missed out on over 35% in gains. This deterioration has been concealed by the broad market rally.
Deterioration in sector-specific performance began around the same time as rapid growth in natural gas supply from Haynesville and Marcellus and oil supply from Bakken. The pure return of producer equities, free from market noise, has been negative even as oil prices advanced. Consequently, pure oil and gas producer performance has been a powerful leading indicator.
Oil and Gas Pipelines Pure Sector Factor
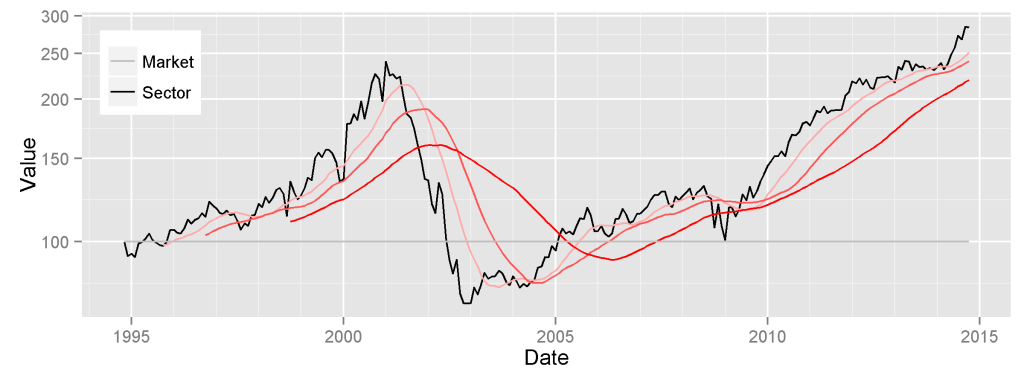
The flip-side of the growth in supply has been the shortage of pipeline capacity. The following are the pure returns for oil and gas pipelines, with market effects removed. This boom in pipelines is a direct consequence of the glut of hydrocarbon production evident in the pure producer performance:
Recent Pure Oil and Gas Producer Performance
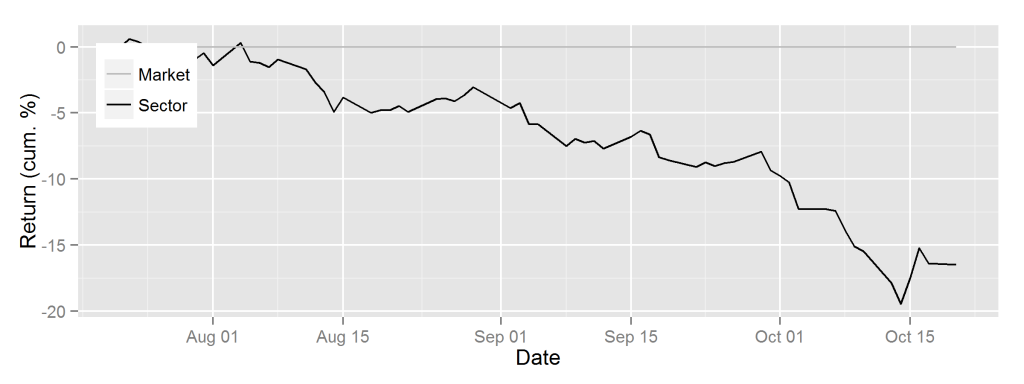
The poor performance of oil and gas producers in October 2014 was a continuation of a long trend. When the broad market experienced hiccups, the underlying trends became evident:
Conclusions
- By stripping away the effects of market and macroeconomic variables, we can calculate the returns of pure sector factors.
- Pure oil and gas producer performance has been a powerful leading indicator of the energy sector selloff.
- The energy cycle peaked in mid-2008 and producers have been in decline since.
- Despite sector index return of over 200% since 2009 lows, sector investors missed out on 35% in returns since 2008 – pure sector performance was a decline of over 35%.
- Failure to isolate pure sector factors left many energy investors complacent and ignorant of the underlying trends as the broad market advanced.


Some themes and sectors may shine if the economy shifts into the late cycle. Here are potential opportunities.