Fisher Asset Management Security Selection Return — 13F Portfolio

The following is a chart of Fisher Asset Management, LLC’s estimated security selection (stock picking) return for all long positions over the past 10 years:

The Security Selection Return of the 13F Portfolio of Fisher Asset Management, LLC

Fisher Asset Management Security Selection Return – 13F Portfolio

The analysis evaluated 10 years of 13F fling history for the firm. It estimated the returns the portfolio would have generated if markets were flat – stock picking performance independent of the market.

Oakmark Fund (OARMX) Technology Sector Skill

In general, even fund managers that generate persistently positive active returns are rarely skilled across the board. They have stronger skills or employ stronger analysts in some sectors than in others.

The Oakmark Fund (OARMX) is no different. Over the past 10 years, it generated ~15% from security selection (stock picking):

The Chart of Cumulative Security Selection Return for Oakmark Fund (OARMX)

Oakmark Fund (OARMX) Security Selection Return

Over the same period, Oakmark Fund lost ~12% from technology sector security selection:

The Chart of Cumulative Security Selection Returns for Technology Sector Security Selection Return for the Technology Sector Portfolio of Oakmark Fund (OARMX)

Oakmark Fund (OARMX) Technology Sector Security Selection Return

Technology investing is notoriously hard for value investors and mutual funds in general. Even with survivor bias, technology portfolios of medium turnover U.S. mutual funds with 10 years of history have under-performed by ~20%.


The Trend Towards U.S. Hedge Fund Passivity

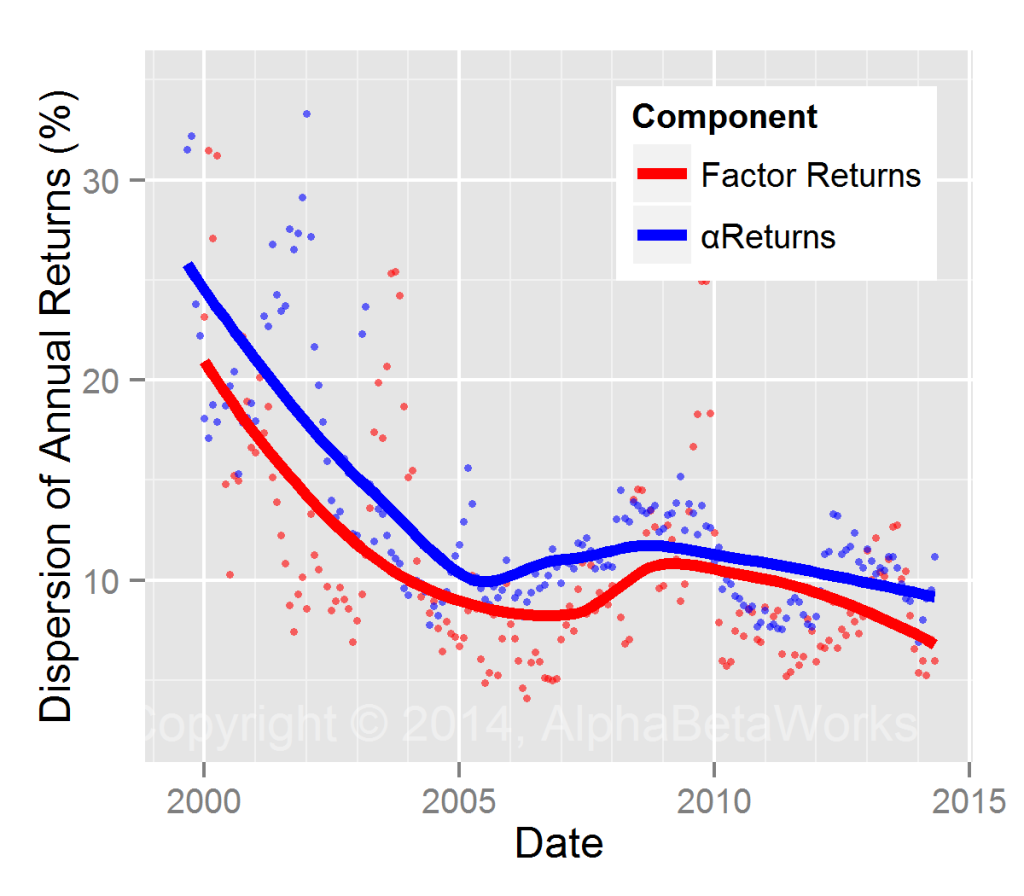
We charted the historical cross sectional standard deviation of factor (systematic) and α (security selection) returns for U.S. hedge funds:

US Hedge Fund Long Portfolio Performance Dispersion

US Hedge Fund Long Portfolio Performance Dispersion

A surprising finding is that, even in midst of the 2008-2009 market volatility spike, the long positions of U.S. hedge funds were less differentiated from each other that they had been in the relatively lower-volatility regime of 2003-2004.

Value Partners High Dividend Stocks Fund — Security Selection

Value Partners High Dividend Stocks Fund has excellent long-term security selection (stock picking) performance. Results are ahead of 2/3 of U.S. mutual funds. However, inconsistency of security selection returns is a concern.

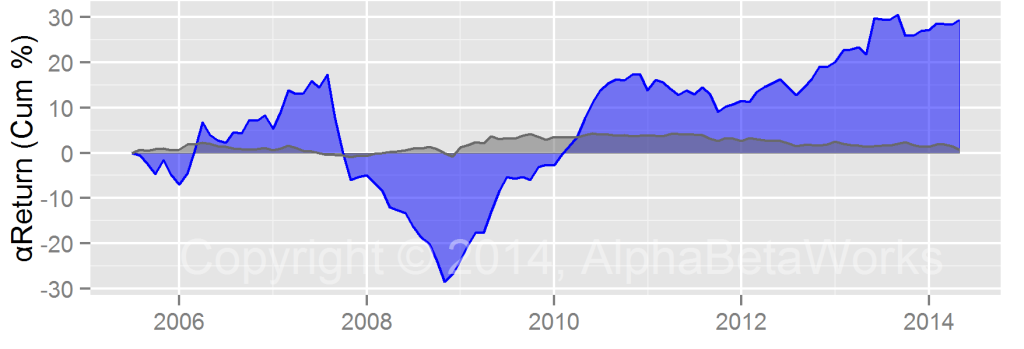
The fund generated approximately 3% annual gross return from security selection:

Value Partners High Dividend Stocks Fund αReturn (AlphaReturn)

Value Partners High Dividend Stocks Fund αReturn (AlphaReturn)

This is the residual return, or αReturn. It is the return in excess of the systematic performance due to the fund’s factor (market) bets. It is also the return a fund would have generated in a flat market.

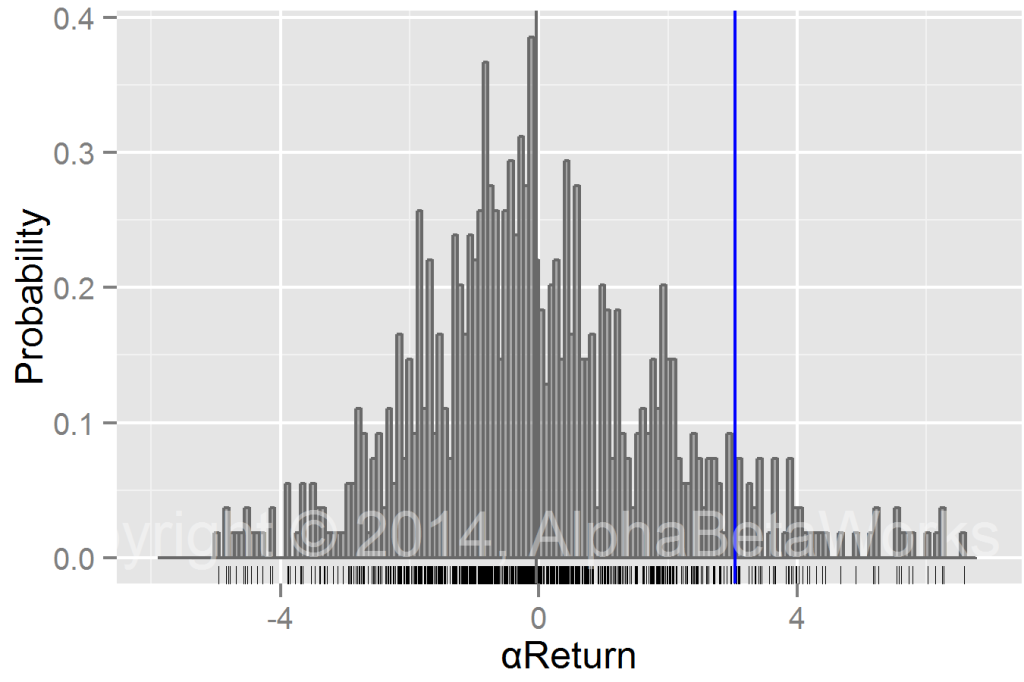
This compares favorably to U.S. mutual funds:

Value Partners High Dividend Stocks Fund and Group αReturn (AlphaReturn) Distribution

Value Partners High Dividend Stocks Fund and Group αReturn (AlphaReturn) Distribution

One major issue is inconsistency. The other is the expense ratio, eating up approximately 2/3 of the historical αReturn.