Category Archives: Mutual Funds

Vanguard Wellington Fund (VWENX) – Market Timing

Vanguard Wellington Fund (VWENX) is an excellent market timer with a track record of increasing exposures to factors that subsequently generate larger-than-typical returns.

Over the past 10 years, the fund returned approximately 7% solely through varying its factor exposures. This compares to an approximately 4% market-timing loss for the average medium turnover U.S. equity mutual fund:

Chart of the historical return due to market timing of Vanguard Wellington Fund (VWENX)

Vanguard Wellington Fund (VWENX) Market Timing Return History

VWENX’s 3-year marker timing return (βReturn3) is well ahead of the group:

Chart of the return distribution of market timing returns of medium turnover U.S. Mutual Funds

U.S. Mutual Fund Market Timing Return Distribution

Given the excellent market-timing performance, VWENX’s bets are worth watching.

Chart of the historical factor exposures of Vanguard Wellington Fund (VWENX)

Vanguard Wellington Fund (VWENX) Historical Factor Exposures

  • The fund’s exposures to finance sector, health sector, and large-caps are larger than typical.
  • The fund’s exposures to consumer sector, energy sector, and utilities are smaller than typical.

Parnassus Core Equity Fund (PRILX) – Returns-Based Analysis

Returns-Based Analysis and Fund Beta

In an earlier article, we discussed the failures of returns-based style analysis – a common method of estimating fund risk:

  • Returns-based analysis is usually flawed when portfolio risk varies over time.
  • Returns-based analysis may not even accurately estimate average or representative risk of the portfolio.
  • Flaws are most pronounced for the most active funds – precisely the ones most in need of accurate analysis.

These flaws can be addressed by analyzing historical portfolio holdings, estimating their factor exposures, and aggregating these estimates. This approach requires a robust risk model and is favored by AlphaBetaWorks.

Parnassus Core Equity Fund (PRILX) Returns-Based Beta

Returns-based analysis estimates market exposure (beta) using one or more linear regressions, possibly with several independent variables. We use one fund, the Parnassus Core Equity Fund (PRILX) as an example. For PRILX, a simple single-factor linear regression estimates beta near 0.84:
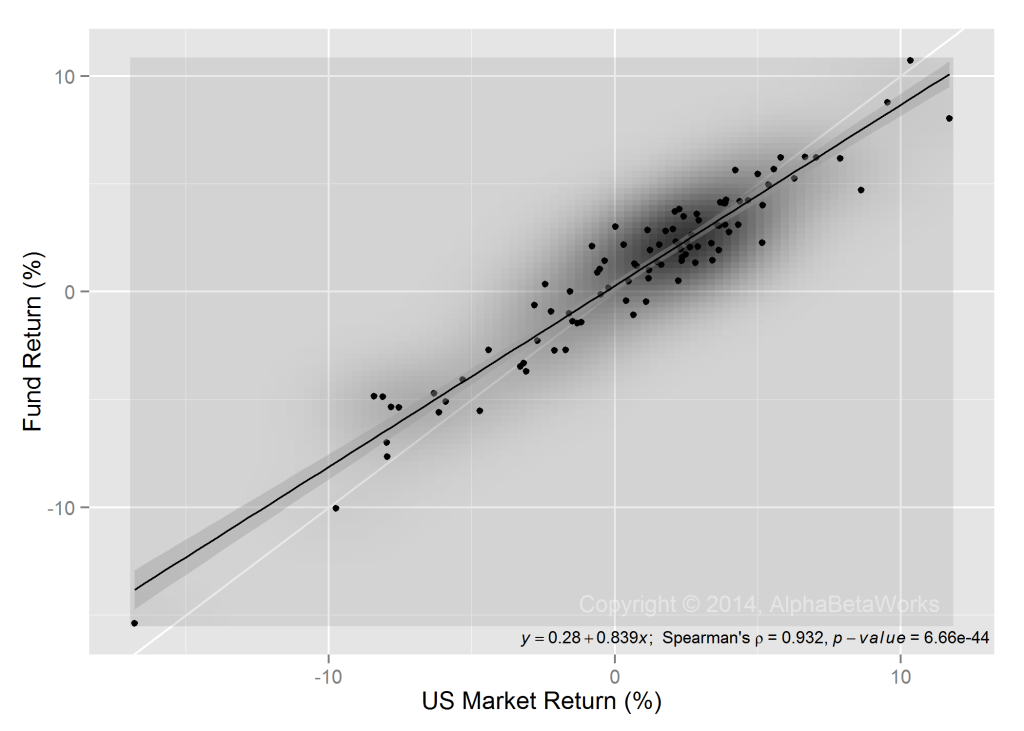
Chart of the relationship of the returns of U.S. Market and Parnassus Core Equity Fund (PRILX)

U.S. Market and Parnassus Core Equity Fund (PRILX) Returns

This type of regression is the foundation of returns-based style analysis.

Parnassus Core Equity Fund (PRILX) Beta History

A key assumption of returns-based analysis is that beta does not vary over the regression period.

To test this U.S. Market beta estimate, we used the AlphaBetaWorks Statistical Equity Risk Model to estimate monthly U.S. Market exposures of PRILX. The model estimated the exposures of individual holdings. It then combined these into aggregate portfolio beta. Over the past 10 years, the fund has varied U.S. Market exposure between 68% and 95% (0.68 to 0.95 beta):
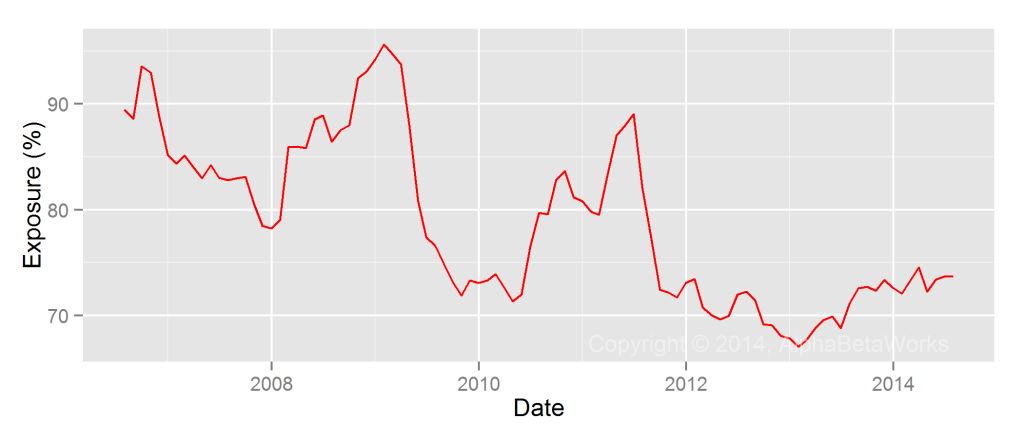
Chart of the historical U.S. Market Exposure (Beta) of Parnassus Core Equity Fund (PRILX)

Parnassus Core Equity Fund (PRILX) – Historical U.S. Market Exposure (Beta)

PRILX’s average U.S. Market exposure was approximately 79% (0.79 beta) during the period. However, actual beta was rarely near the average:
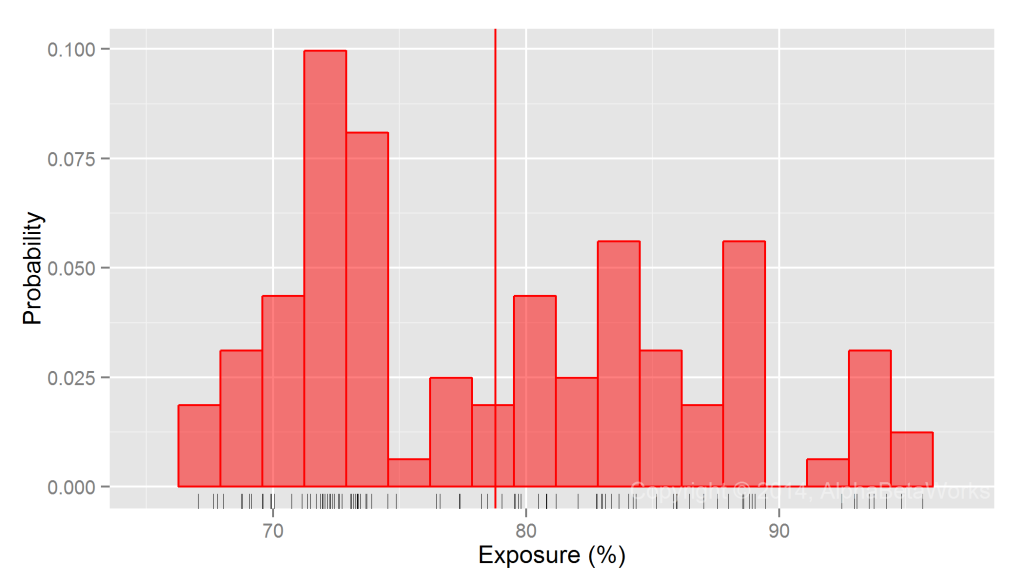
Chart of the distribution of U.S. Market Exposure (Beta) of Parnassus Core Equity Fund (PRILX)

Parnassus Core Equity Fund (PRILX) – U.S. Market Exposure (Beta) Distribution

Implications of Beta Estimation Errors

For low-volatility funds whose risk profiles vary little over time, the shortcomings of returns-based attribution are relatively minor. For higher volatility strategies, they are severe.

The 5% difference in estimate exposure (0.05 difference in estimated beta) above is not trivial: U.S. Market is up approximately 140% over the past 10 years. A 0.05 difference in estimated average beta translates into a 7% difference in returns attributable to beta over this period.

In addition, returns-based analysis obscured the variation in beta over history: Since 2012 beta has been below 0.75. Consequently, returns-bases analysis’ attribution of performance to market and non-market sources is further off the mark.

iShares Core High Dividend ETF (HDV) Alpha and Beta

iShares Core High Dividend ETF (HDV) is a low-risk fund that has consistently delivered positive risk-adjusted return.

iShares Core High Dividend ETF (HDV) – Historical Beta

U.S. Market exposure (beta) of the fund has varied in the narrow window between 0.52 and 0.60:

Chart of the history of U.S. Market Beta for iShares Core High Dividend ETF (HDV)

iShares Core High Dividend ETF (HDV) U.S. Market Beta History

iShares Core High Dividend ETF (HDV) – Historical Alpha

The fund has consistently generated positive risk-adjusted return from security selection (αReturn):

Chart of the risk-adjusted returns from security selection of iShares Core High Dividend ETF (HDV)

iShares Core High Dividend ETF (HDV) Security Selection Return History

This αReturn exceeds the results of 95% of U.S. mutual funds with medium and lower portfolio turnover rates:

Chart of the security selection return of iShares Core High Dividend ETF (HDV) compared to the peer group of all U.S. mutual funds with medium turnover

iShares Core High Dividend ETF (HDV) Security Selection Return Vs Peers


Artisan International Fund (ARTIX) and Artisan International Value Fund (ARTKX) – Security Selection

Both Artisan International Fund (ARTIX) and Artisan International Value Fund (ARTKX) show excellent security selection (stock picking) performance over the past 10 years.

If all markets were flat for the past 10 years, ARTIX would have generated approximately 0% cumulative return from stock picking. This is not bad: The average fund would have lost money, even with the massive survivor bias of the peer group (funds that have been around for 10 years):

Chart of the Security Selection Return of Artisan International Fund (ARTIX)

Artisan International Fund (ARTIX) Security Selection Return

The results of ARTKX are spectacular. It would have made over 35% if markets were flat – one of the best track records among domestic and international funds:

Chart of the Security Selection Return of Artisan International Value Fund (ARTKX)

Artisan International Value Fund (ARTKX) Security Selection Return

A word of caution: ARTIX shows signs of over-capitalization and position scalability issues. It lost approximately 30% over the past 10 years due to position sizing. Its largest positions were (consistently) its worst stock picks:

The Position Sizing Return of Artisan International Fund (ARTIX)

Artisan International Fund (ARTIX) Position Sizing Return

In summary: Stock picking skills of the flagship international funds appear strong, but their scalability is a concern.

Oakmark Fund (OARMX) Technology Sector Skill

In general, even fund managers that generate persistently positive active returns are rarely skilled across the board. They have stronger skills or employ stronger analysts in some sectors than in others.

The Oakmark Fund (OARMX) is no different. Over the past 10 years, it generated ~15% from security selection (stock picking):

The Chart of Cumulative Security Selection Return for Oakmark Fund (OARMX)

Oakmark Fund (OARMX) Security Selection Return

Over the same period, Oakmark Fund lost ~12% from technology sector security selection:

The Chart of Cumulative Security Selection Returns for Technology Sector Security Selection Return for the Technology Sector Portfolio of Oakmark Fund (OARMX)

Oakmark Fund (OARMX) Technology Sector Security Selection Return

Technology investing is notoriously hard for value investors and mutual funds in general. Even with survivor bias, technology portfolios of medium turnover U.S. mutual funds with 10 years of history have under-performed by ~20%.


Value Partners High Dividend Stocks Fund — Security Selection

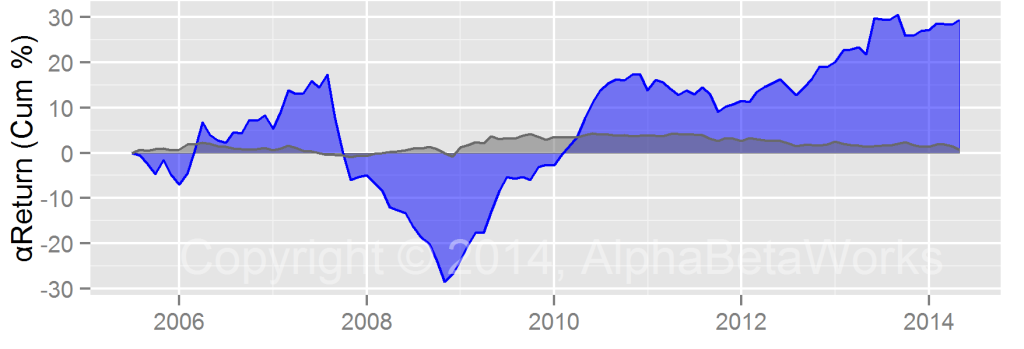
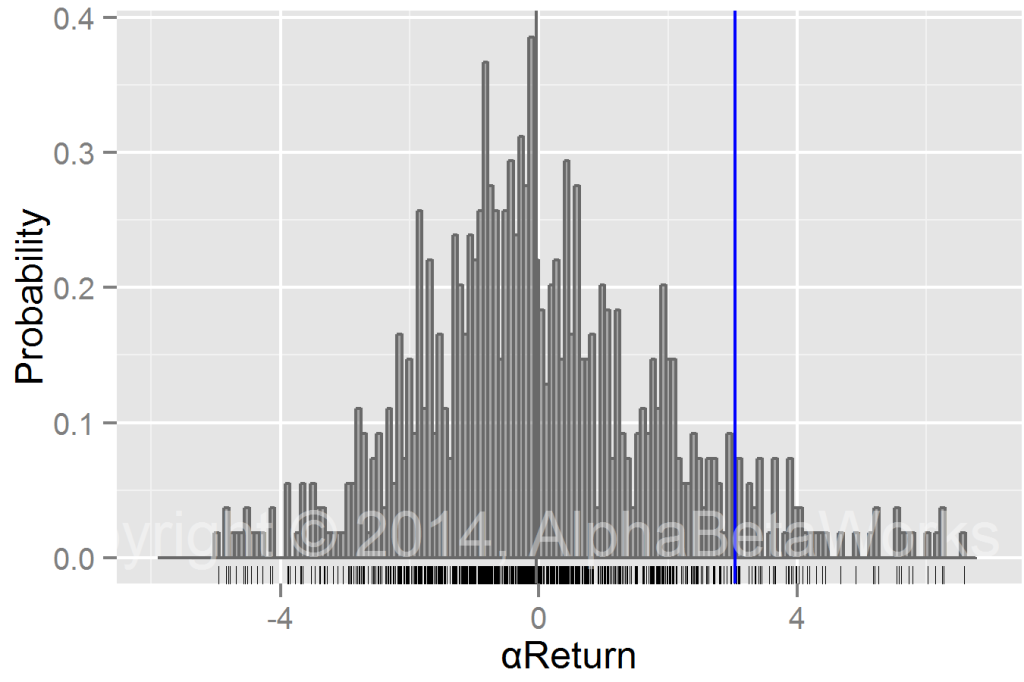
Value Partners High Dividend Stocks Fund has excellent long-term security selection (stock picking) performance. Results are ahead of 2/3 of U.S. mutual funds. However, inconsistency of security selection returns is a concern.

The fund generated approximately 3% annual gross return from security selection:

Value Partners High Dividend Stocks Fund αReturn (AlphaReturn)

Value Partners High Dividend Stocks Fund αReturn (AlphaReturn)

This is the residual return, or αReturn. It is the return in excess of the systematic performance due to the fund’s factor (market) bets. It is also the return a fund would have generated in a flat market.

This compares favorably to U.S. mutual funds:

Value Partners High Dividend Stocks Fund and Group αReturn (AlphaReturn) Distribution

Value Partners High Dividend Stocks Fund and Group αReturn (AlphaReturn) Distribution

One major issue is inconsistency. The other is the expense ratio, eating up approximately 2/3 of the historical αReturn.